. 2025 Jun 17;22(1):17.
doi: 10.1186/s12989-025-00632-x.

Impact of environmental microplastic exposure on HepG2 cells: unraveling proliferation, mitochondrial dynamics and autophagy activation

Affiliations

Impact of environmental microplastic exposure on HepG2 cells: unraveling proliferation, mitochondrial dynamics and autophagy activation

Hana Najahi et al. Part Fibre Toxicol. .

Abstract

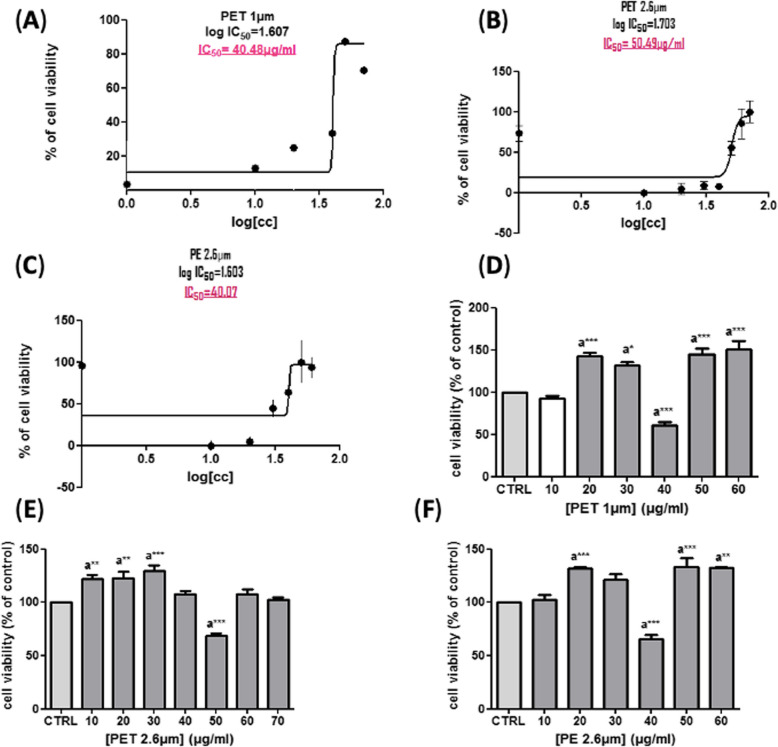
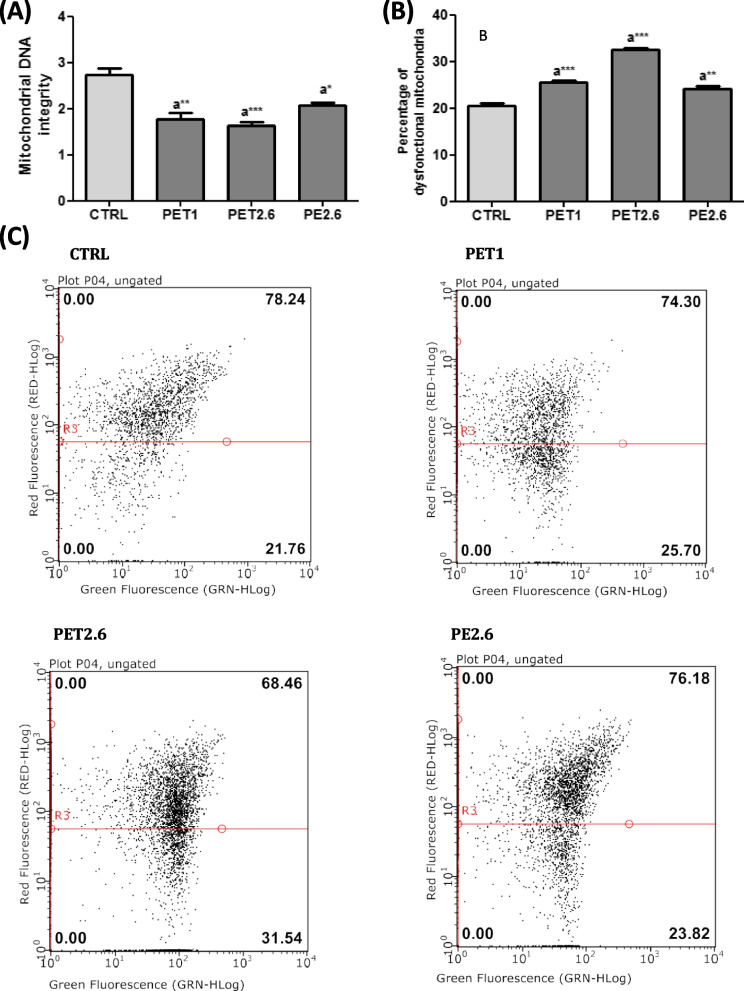
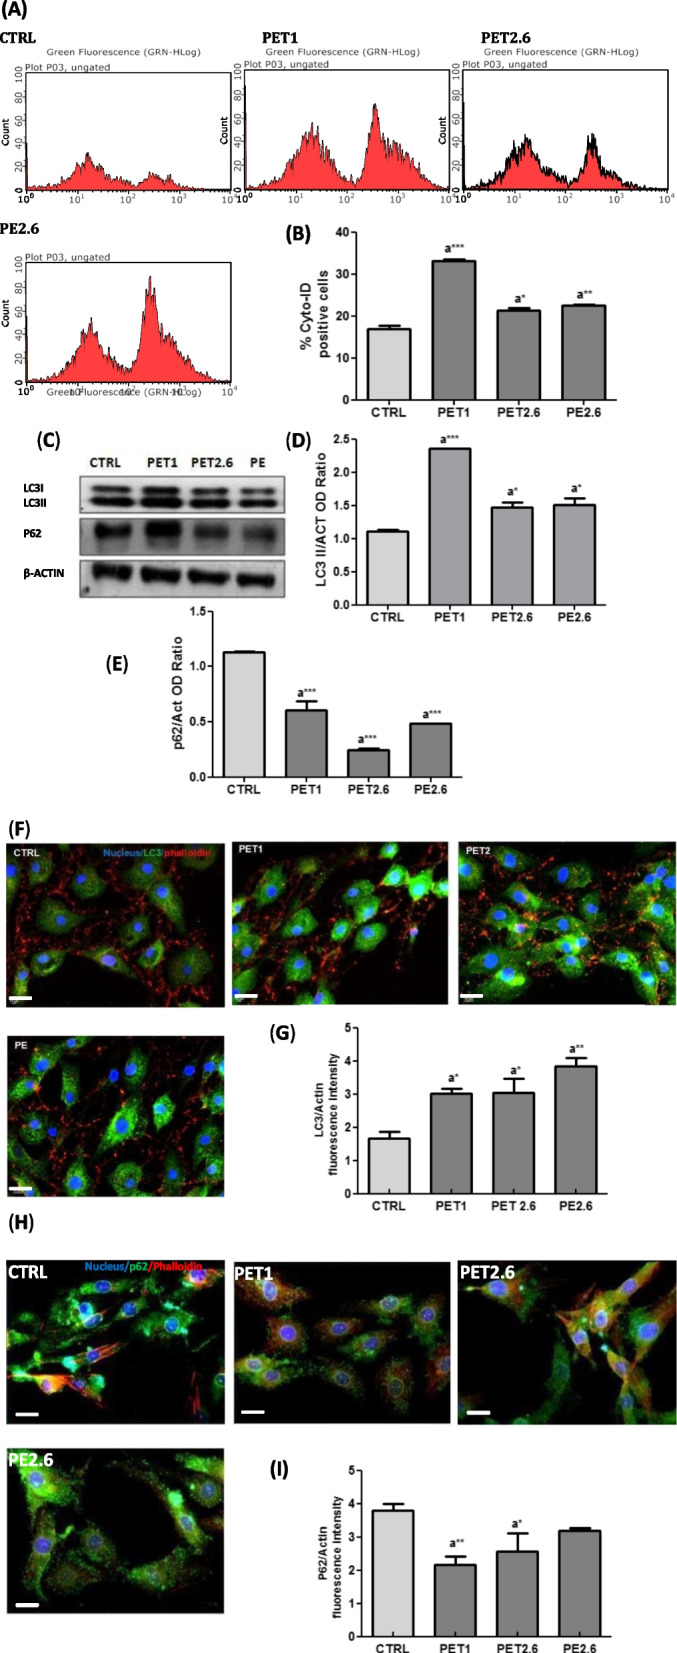
The rise of microplastic (MPs) pollution presents a pressing environmental issue, raising concerns about its potential health impacts on human populations. Given the critical role of the liver in detoxification and metabolism, understanding the effects of MPs on the human hepatoma cell line HepG2 cells is essential for comprehensively assessing the dangers associated with MPs pollution to human health. Until now, the assessment of the harmful impact of polyethylene (PE) and polyethylene terephthalate (PET) on HepG2 has been incomplete and lacks certain essential data points. In this particular setting, we examined parameters such as cell viability, oxidative stress, mtDNA integrity, mitochondrial membrane potential, and autophagy in HepG2 cells exposed for 72 h to PET and PE at a concentration of 10 µg/mL. Our data revealed that exposure of HepG2 to MPs causes an increase in cell viability accompanied by a heightened ROS and altered mitochondrial function, as revealed by decreased mtDNA integrity and membrane potential. In addition, results demonstrated that exposure to PET and PE activated autophagic events, as suggested by the increased levels of the specific markers LC3 and p62. This last point was further confirmed using bafilomycin, a specific blocker that hinders the merging of autophagosomes and lysosomes, thereby blocking autophagic degradation processes. Given the increasing evidence of food chain MPs contamination and its possible harmful effects, our data should be carefully considered.

Keywords: Bafilomycin A1; Hepatocellular carcinoma cell line; Macroautophagy; Mitophagy; PE; PET.


Conflict of interest statement

Declarations. Ethics approval and consent to participate: Not applicable. Competing interests: The authors declare no competing interests.

Figures

Fig. 1
Fig. 1
MPs (PET 1 µm, PET 2,6 µm and PE 2,6 µm) exposure increase cell viability of HepG2 cell line. A Standard curves and IC50 values of PET 1 µm for HepG2 cell line. B Standard curves and IC50 values of PET 2.6 µm for HepG2 cell line. C Standard curves and IC50 values of PE 2.6 µm for HepG2 cell line. Calculation of IC50 values in Graph Pad Prism. Fraction of alive cells [%] is provided on the vertical axis and the log (concentration) on the horizontal axis. The IC50 is the concentration at which the curve passes through the 50% inhibition level. D, E and F Effect of MPs on cell viability. HepG2 cells were treated with different concentrations of PET and PE. CCK8 assay was performed to measure cell viability
Fig. 2
Fig. 2
Influence of MPs (PET 1 µm, PET 2,6 µm and PE 2,6 µm) exposure on ROS generation. A Histogram showing TBARS levels of HepG2 cells exposed to MPs. B Histogram showing the percentage of DCF-DA positive cells. All values are expressed as means ± standard deviation (*p < 0.05, ** p < 0.01). Statistical significance was evaluated by ANOVA (at least p < 0.05) followed by Tukey test for multigroup comparison. All the experiments were performed in triplicate
Fig. 3
Fig. 3
MPs exposure altered mitochondrial function and mtDNA copy number. A Histogram of Mitochondrial DNA integrity B Histogram showing the percentage of dysfunctional mitochondria C The plot of JC1 from flow cytometry on mitochondrial membrane potential. All Data are expressed as means ± SD (*p < 0.05, ** p < 0.01, ***p < 0.001). Data are representative of three independent measurements
Fig. 4
Fig. 4
Autophagic flux analysis through Cyto-D assay, western blotting and immunofluorescence of control and MPs (PET 1 µm, PET 2,6 µm and PE 2,6 µm) treated HepG2. A Representative intracellular Flow Cytometric Cyto-ID B Histogram showing the percentage of Cyto-D positive cells. C WB analysis shows the expression of LC3-I (16 kDa), LC3-II (14 kDa) and p62 (62 kDa) in HepG2 exposed to MPs. D The histogram shows the LC3-II level. Data were normalized with beta-Actin (44 kDa). E Histogram showing the relative level of p62. Proteins levels were quantified using the ImageJ program. Data were normalized with beta- Actin and reported as OD ratio. All the values are expressed as means ± SEM. Asterisks indicate a significant difference from the respective control (*: p < 0.05), (** p < 0.01) and (***: p < 0.001) after one-way ANOVA using Tukey’s Post Hoc test. F LC3 (green), phalloidin (Red) immunolocalization HepG2 cells treated with MPs. Cell nuclei were stained with DAPI (blue). The images were captured at × 20 magnification. Scale bars represent 20 µm. G the histogram shows the quantification of LC3 fluorescence signal intensity. Data were normalized with the signal of phalloidin using ImageJ. All values are expressed as means ± standard deviation. PET 1, PET 2,6 and PE 2,6 Vs CTRL: (*: p < 0.05, ** p < 0.01). H Representative micrographs of p62 immunostaining (green), and phalloidin (red) on HepG2 cultures treated with MPs. Cell nuclei were stained with DAPI (blue). I The graph shows the quantification of p62 fluorescence signal intensity Using Tukey’s Post Hoc test. Asterisks indicate a significant difference from the respective control (*: p < 0.05,**: p < 0.01) after one-way ANOVA using Tukey’s Post Hoc test
Fig. 5
Fig. 5
Co-treatment with bafilomycin A1 A WB analysis showing the expression of LC3-I (16 kDa), LC3-II (14 kDa) and p62 (62 kDa) in HepG2 exposed to MPs in the presence of Bafilomycin A1. Prior to protein extraction, cells were incubated for 2 h with 100 nM Bafilomycin A1 (an inhibitor of lysosomal degradation). B Histogram shows the LC3-II level. Data were normalized with beta-Actin (44 kDa). C Histogram showing the relative level of p62. Protein levels were quantified using the ImageJ program. Data were normalized with beta-Actin and reported as OD ratio. All the values are expressed as means ± SEM. Asterisks indicate a significant difference from the respective control (*: p < 0.05), (** p < 0.01) and (***: p < 0.001) after one-way ANOVA using Tukey’s Post Hoc test

References

    1. Geyer R. Chapter 2 - Production, use, and fate of synthetic polymers. In: Plastic waste and recycling. environmental impact, societal issues, prevention, and solutions. 2020. p. 13–32. 10.1016/B978-0-12-817880-5.00002-5.
    1. Galloway T, Lewis CN. Marine microplastics spell big problems for future generations. Proc Natl Acad Sci U S A. 2016.10.1073/pnas.1600715113. - PMC - PubMed
    1. Oliveri Conti G, Rapisarda P, Ferrante M. Relationship between climate change and environmental microplastics: a one health vision for the platysphere health. One Health Adv. 2024;2:17. 10.1186/s44280-024-00049-9.
    1. EFSA Panel on Contaminants in the Food Chain, E.collab. Presence of microplastics and nanoplastics in food, with particular focus on seafood. EFSA J. 2016;14(6):e04501.10.2903/j.efsa.2016.4501. - PMC - PubMed
    1. Garrido Gamarro E, Costanzo V. Microplastics in food commodities – a food safety review on human exposure through dietary sources. Food Safety and Quality Series No. 18. Rome: FAO; 2022. 10.4060/cc2392en.

MeSH terms

LinkOut - more resources