. 2025 Jun 17;23(1):666.
doi: 10.1186/s12967-025-06682-1.

Pathway-based cancer transcriptome deciphers a high-resolution intrinsic heterogeneity within bladder cancer classification

Affiliations

Pathway-based cancer transcriptome deciphers a high-resolution intrinsic heterogeneity within bladder cancer classification

Zhan Wang et al. J Transl Med. .

Abstract

Background: The heterogeneity of bladder cancer (BLCA) is affected by its inherent transcriptional properties and tumor microenvironment (TME). Stromal transcriptional components in the TME significantly influence the transcriptional classification of BLCA, and the intrinsic biological transcriptional characteristics of cancer cells may be obscured by the dominant, lineage-dependent transcriptional components of stromal origin. This study aimed to explore the degree and mechanisms by which cancer-intrinsic gene expression profiles contribute to the classification and prognosis of BLCA patients.

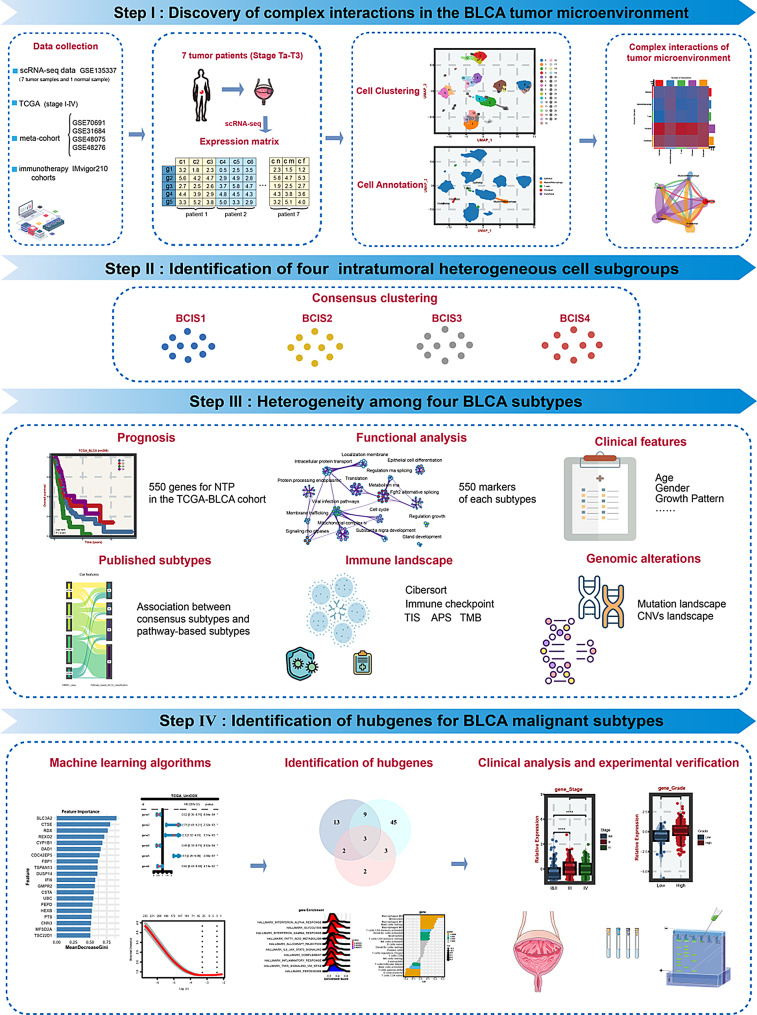
Materials and methods: In this study, BLCA single-cell transcriptome data from GSE135337 were used to identify pure tumor cells in BLCA and explore the different intrinsic heterogeneous cell subgroups of BLCA through pathway-based cancer transcriptome classification. Additionally, BLCA intrinsic subtypes were uncovered in the TCGA BLCA dataset based on the characteristic genes of the subgroups. Lastly, various machine learning algorithms were applied to identify novel potential targets of BLCA, following which their pro-tumorigenic effects were experimentally verified.

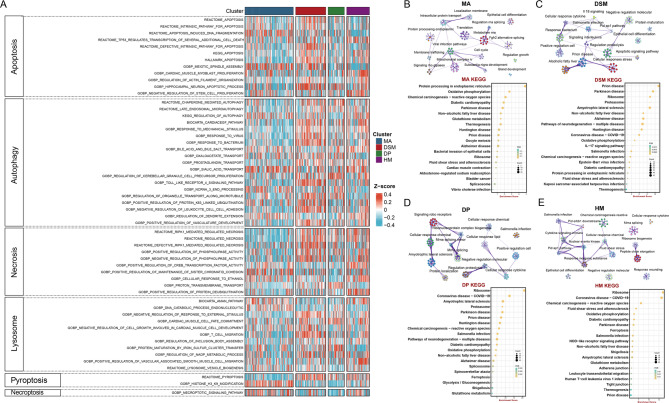
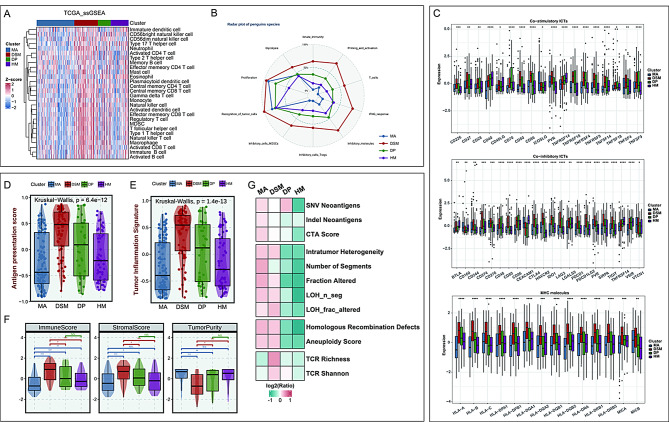
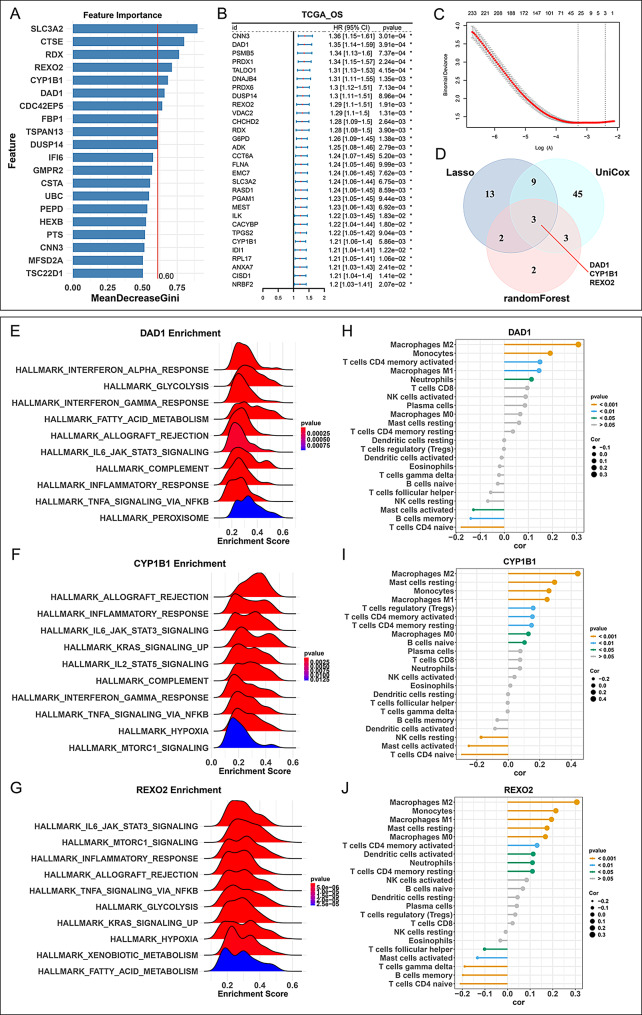
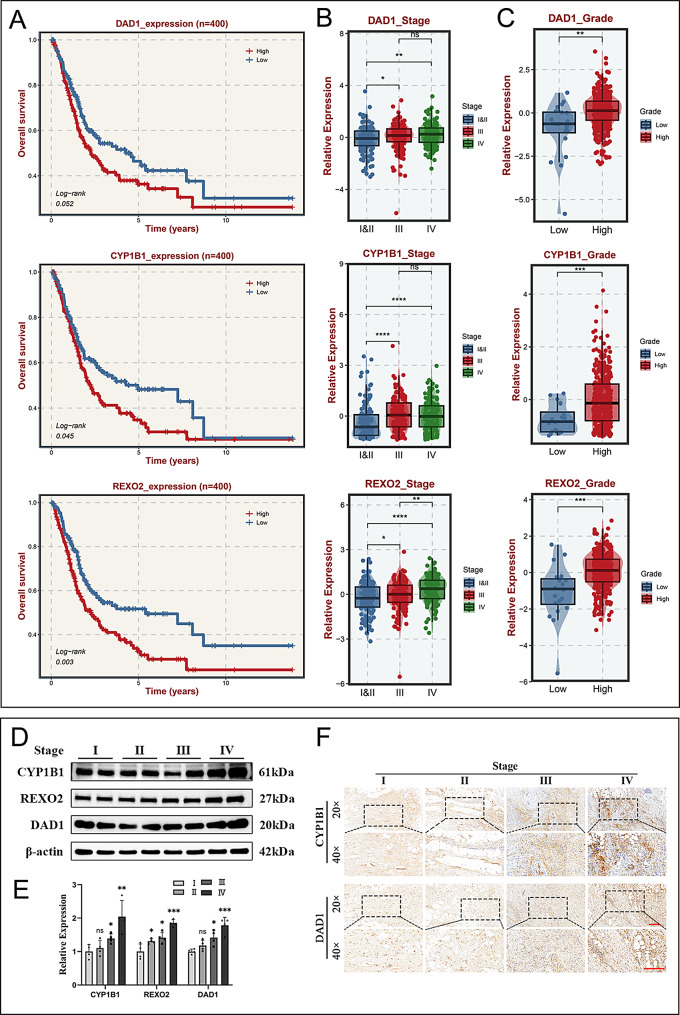
Results: Four BLCA intrinsic subtypes with different molecular, functional and phenotypic characteristics were successfully identified. Specifically, MA and DP subtypes demonstrated malignant phenotypes, accompanied by unfavorable clinical prognoses, limited involvement in cell death pathways, marked cell proliferation, and diminished immune activation. Notably, MA subtype exhibited the most favorable response to immunotherapy, potentially attributable to its distinctive tumor immune microenvironment. DSM subtype represented an immune-rich subtype with the optimal prognosis, characterized by abundant immune cells, high levels of co-stimulatory, co-inhibitory, major histocompatibility complex molecules, and a potential for immunotherapy response. On the other hand, HM subtype was associated with a high level of autophagy and necrosis and an "immune-hot" TIME. Furthermore, BLCA intrinsic subtypes effectively classified independent sets of BLCAs, with limited overlap with existing transcriptional classifications and showcasing unprecedented predictive and prognostic value. Finally, the DP subtype, associated with the worst prognosis, was further analyzed, leading to the identification of three potential target genes (DAD1, CYP1B1, and REXO2) significantly associated with metabolic disorders, as well as BLCA stage and grade.

Conclusion: This study identified a promising platform for understanding intrinsic tumor heterogeneity, which could offer new insights into the intricate molecular mechanisms of BLCA. Targeted therapy against BEXO2 may improve the prognosis of BLCA patients by regulating mitochondria-related metabolic disorders.

Keywords: Bladder cancer; Immune microenvironment; Intrinsic heterogeneity; Metabolic disorder; Molecular subtypes; Single-cell RNA-seq.


Conflict of interest statement

Declarations. Ethics approval and consent to participate: All human samples procedures were approved by the Ethics Committee of Zhengzhou University’s First Affiliated Hospital (2024-KY-1687). Consent for publication: All Authors have seen and approved the manuscript and consent publication. Competing interests: The authors declare that they have no competing interests.

Figures

Fig. 1
Fig. 1
Flowchart of identifying malignant intrinsic subtypes of BLCA
Fig. 2
Fig. 2
Cellular atlas and identification of four primary biological states in malignant epithelial cells of BLCA. (A) The 36 407 tumor cells’ UMAP graphic, color-coded by the clusters. (B) The 7 tumor patients’ UMAP graphic, color-coded by the patients, displays the source of the samples. (C) Violin diagram for expression of DEG in each cell cluster. (D) The 36 407 tumor cells’ UMAP graphic, color-coded by the associated cell types. (E) UMAP plot of expected outcomes for the cell cycle analysis. (F) The proportional plotting graph of the five cell types for every sample. (G) Quantity network and heatmap of interactions among five cell types. (H) Intensity network and heatmap of interactions among five cell types. (I) The computational framework of scBiPaD. (J) CDF graphic with the k value between 2 and 9, and the relative changes for the k values and area under the CDF curve. (K) Consensus matrix heatmap after categorizing all cells into four subgroups. (L) The distribution plots of four subgroups in every samples. (M) Heatmap showing single-cell subpopulations’ biological activities categorized by frequently triggered pathways (40 out of 5,253 pathways; two-sided MWW test, p-Value < 0.01). Cell subpopulations were shown in columns, and biological activities were shown in rows. The color shade represented the activity degree of the pathways. Blue, BCIS1; red, BCIS2; green, BCIS3; purple, BCIS4
Fig. 3
Fig. 3
The development and verification of BLCA intra-tumoral heterogeneity molecular subtypes in bulk cohorts and clinical characteristics for subtypes. (A) Overall survival (OS), disease-special survival (DSS), and progression-free survival (PFS) study among four subtypes in TCGA cohort. (B) Kaplan-Meier of OS with log-rank test for four subtypes in IMvigor210-cohort. (C) Sankey diagram of BLCA subtypes assignment (n = 288 samples) based on pathway-based classifications and consensus molecular classifications reported previously, including NMIBC_class (X-squared = 148.56, df = 9, p-value < 2.2e-16), MIBC_class (X-squared = 77.44, df = 15, p-value = 2.046e-10), Baylor.subtype (X-squared = 36.312, df = 3, p-value = 6.434e-08), CIT.subtype (X-squared = 156.55, df = 18, p-value < 2.2e-16), Lund.subtype (X-squared = 167.9, df = 27, p-value < 2.2e-16), MDA.subtype (X-squared = 108.89, df = 6, p-value < 2.2e-16), TCGA.subtype (X-squared = 99.537, df = 12, p-value = 6.861e-16), and UNC.subtype (X-squared = 68.575, df = 3, p-value = 8.617e-15). Pearson’s Chi-squared test was used to assess whether there was a significant association between the two classifiers. (D) Univariate and multivariate Cox regression analysis of the clinicopathological features in TCGA BLCA cohort, respectively for OS, PFS, and DSS. (E) The distinct clinical characteristics among four BLCA subtypes. ns P > 0.05, * P < 0.05, ** P < 0.01, *** P < 0.001. (F) The distribution plots of tumor growth pattern among four subtypes. (G) The distribution plots of immunotherapy sensitivity among four subtypes in IMvigor210-cohort
Fig. 4
Fig. 4
Functional enrichment of the four BLCA heterogeneity subtypes. (A) GSEA of cell death signaling pathways for the BLCA subtypes. The disparities among four BLCA subtypes in tumor cell death behavior were displayed in a heatmap. (B) Enrichment map network and KEGG enrichment analysis of MA subtype. Enrichment map network containis statistically significant, nonredundant GO categories. Nodes stand for terms in the Gene Ontology (GO) and lines of their connectivity. Node size is positively correlated with the total number of genes in the GO category, with the range denoted by keys and line thickness representing the similarity coefficient. (C) Enrichment map network and KEGG enrichment analysis for DSM subtype markers. (D) In DP subtype, the enrichment map network and KEGG enrichment analysis showed that DP subtype mainly focused on metabolic disorders. (E) Enrichment map network and KEGG enrichment analysis of HM subtype
Fig. 5
Fig. 5
The landscape of the tumor immune microenvironment across distinct BLCA subtypes. (A) Heatmap of immune cell infiltration by SsGSEA algorithm. (B) Radar plot of BLCA subtypes for immune gene expression levels. (C) The relative expression of co-stimulatory, co-inhibitory immune check points, and MHC molecules in the four subtypes. (D) Antigen processing and presenting machinery score (APS) in BLCA subtypes. (E) The tumor inflammation signature (TIS) score of BLCA subtypes. (F) Immune score, stromal score, and tumor purity in BLCA subtypes. (G) Immune indicators collected and compared between the four subtypes
Fig. 6
Fig. 6
Machine learning algorithms and hub targets acquisition. (A) The identification of potential targets using the randomForest algorithm. The abscissa of the figure is the score of importance, and the ordinate is the gene name. The red line represents the cut-off value. (B) Univariate Cox regression analysis of DP subtype signature genes in TCGA BLCA cohort. (C) A LASSO model was employed to identify significant genes. The partial likelihood deviance was plotted as a function of log(λ). Vertical lines denote the 1-SE rule for model selection. 27 genes were selected with non-zero coefficients at the optimal λ. (D) Venn diagram for identifying hub genes of BLCA. (E) Single gene GSEA enrichment analysis for DAD1 based on hallmark gene set. (F) Single gene GSEA enrichment analysis for CYP1B1 based on hallmark gene set. (G) Single gene GSEA enrichment analysis for REXO2 based on hallmark gene set. (H) Correlation between DAD1 and 22 infiltrating immune cells. (I) Correlation between CYP1B1 and 22 infiltrating immune cells. (J) Correlation between REXO2 and 22 infiltrating immune cells
Fig. 7
Fig. 7
Malignancy phenotypes and experimental validation of hubgenes. (A) Kaplan-Meier of OS with log-rank test in TCGA BLCA cohort, respectively, for the grouping of the median expression of DAD1, CYP1B1, and REXO2. (B) The relative expression of different stages for DAD1, CYP1B1, and REXO2, respectively. (C) The relative expression of different grades for DAD1, CYP1B1, and REXO2, respectively. Ns represents P-value > 0.05; *, **, ***, **** represents P-value < 0.05. (D) Western blotting of DAD1, CYP1B1, and REXO2 proteins in different tumor stages. β-actin was used as the reference protein. (E) The bar graphs show the relative expression of DAD1, CYP1B1, and REXO2 proteins in different tumor stages. (F) Immunohistochemistry of DAD1 and CYP1B1 proteins in four tumor stages

Similar articles

References

    1. Compérat E, et al. Current best practice for bladder cancer: a narrative review of diagnostics and treatments. Lancet. 2022;400(10364):1712–21. - PubMed
    1. Cheng G, et al. Predicting bladder cancer survival with high accuracy: insights from MAPK pathway-related genes. Sci Rep. 2024;14(1):10482. - PMC - PubMed
    1. Alifrangis C, et al. Molecular and histopathology directed therapy for advanced bladder cancer. Nat Rev Urol. 2019;16(8):465–83. - PubMed
    1. Akman B, et al. Nucleocytoplasmic β-catenin expression contributes to neuroendocrine differentiation in muscle invasive bladder cancer. Cancer Sci. 2024;115(9):2985–97. - PMC - PubMed
    1. Li S, et al. Integrated analysis of bulk and single-cell RNA-seq data reveals cell differentiation-related subtypes and a scoring system in bladder cancer. J Cell Mol Med. 2024;28(19):e70111. - PMC - PubMed

MeSH terms

LinkOut - more resources