. 2025 Aug 11;6(8):101418.
doi: 10.1016/j.xplc.2025.101418. Epub 2025 Jun 16.

Natural peptidoglycan nanoparticles enable rapid antigen purification and potent delivery of plant-derived vaccines

Affiliations

Natural peptidoglycan nanoparticles enable rapid antigen purification and potent delivery of plant-derived vaccines

Shi-Jian Song et al. Plant Commun. .

Abstract

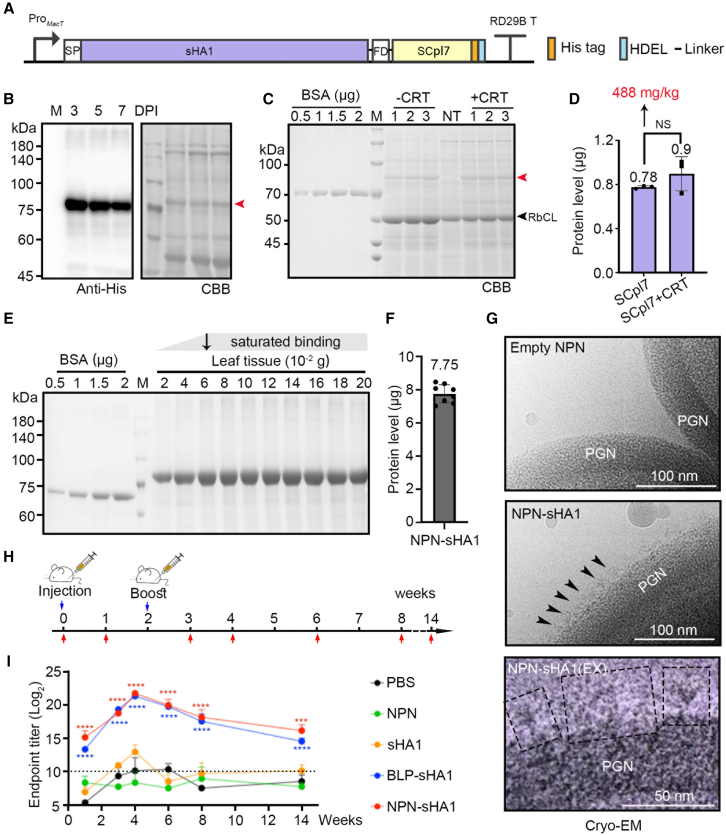
Plant molecular farming is a promising platform for biopharmaceutical production, however, downstream processing remains a challenge due to cost and complexity. In this study, we present natural peptidoglycan nanoparticles (NPNs) derived from Gram-positive lactic acid bacteria as a novel tool for plant-based vaccine purification and delivery. Sequential treatment with trichloroacetic acid and trypsin effectively reduced NPN size, removing residual host subcellular constructs and proteins while preserving protein-binding capacity. Optimizing trimeric protein anchors and trimerization elements for plant-based expression enabled protein binding at low temperatures, minimizing proteolytic degradation. NPNs conjugated with plant-derived hemagglutinin elicited strong humoral immune responses in mice. Additionally, NPNs enhanced the retention of GFP at the injection site and supported efficient polyclonal antibody generation. These findings establish NPNs as a versatile platform for plant-based recombinant vaccine purification and delivery.

Keywords: Nicotiana benthamiana; adjuvant; bacterium-like particle; pep; plant molecular pharming; protein purification; tidoglycan; vaccine.


Figures

Figure 1
Figure 1
Screening of plant-preferred trimeric domains and BLP-binding domains (A and F) Schematic representation of recombinant GFP constructs in the pTEX1L binary vector. FD, foldon domain; GFP, green fluorescent protein; HDEL, ER retention signal; mCor1, the trimerization motif of mouse Coronin 1A; ProMacT, promoter of AtMacT; RD29B T, terminator of AtRD29B; SP, the signal peptide of AtBIP1. (B, C, and G) GFP fluorescence images of indicated constructs expressed in N. benthamiana leaves via agroinfiltration, captured 3 DPI. Scale bar, 1 cm. (D) Schematic diagram of BLP incubated with a gradient amount of total soluble proteins (TSPs) extracted from recombinant GFP construct infiltrated leaf tissues. (E and H) SDS-PAGE and CBB analyses of BLP-bound recombinant GFP proteins from gradient amounts of TSP extracted from infiltrated leaf tissues. Bovine serum albumin (BSA) standards were loaded on the same gel for generating the standard curve. M, molecular weight. (I) Quantitative results of protein binding shown as mean ± SD (n = 3). (J–N) Binding assay of GFP–FD–LLysM and GFP–FD–SCpl7 at different temperatures. TSP extracted from 0.1 g of leaf tissue was incubated with BLPs prepared from L. sakei cells (1 mL, OD600 = 1) at 37 °C or 4 °C for 15 min. The pellet was collected for SDS-PAGE analysis. Red asterisks indicate the main bands of GFP–FD–LLysM and GFP–FD–SCpl7. Band densities were measured and are shown in (K) and (M), respectively. The blue arrowhead indicates the aggregated GFP–FD–LLysM and GFP–FD–SCpl7. Band densities were measured and are shown in (L) and (N). The black arrowhead indicates a non-specific protein that binds to BLP at 37 °C. Data represent mean ± SD (n = 3). Statistical significance was determined by the Student’s t test using GraphPad Prism.
Figure 2
Figure 2
Preparation and representation of natural peptidoglycan nanoparticles (NPNs) (A) Schematic representation of BLP and NPN preparation. Live cells were heated in 10% TCA for 10 min for BLP preparation. BLPs were digested by proteases at 37 °C for 2 h for NPN preparation. (B) Total protein content of BLP after treatment with trypsin, pepsin, and proteinase K. BLPs (1 mL reaction volume) were treated with various proteases, centrifuged, and the pellet was crushed by vortexing with glass beads. Protein levels were quantified by Bradford assay. Data represent mean ± SD (n = 3). (C) SDS-PAGE and CBB staining analysis of total proteins from live cells (1), BLPs (2), trypsin-treated BLPs (3), pepsin-treated BLPs (4), and proteinase K-treated BLPs (5). Equal amounts of live L. sakei cells (from 1 mL culture, OD600 = 1) were processed as described in Methods. Pellets were crushed with glass beads, followed by boiling in SDS sample buffer for SDS-PAGE analysis. Whole lane densities were quantified using ImageJ. Data represent mean ± SD (n = 3). (D) Binding capacity of GFP–FD–SCpl7 to BLPs before and after trypsin, pepsin, or proteinase K treatment. The black arrowhead indicates the main band of GFP–FD–SCpl7. (E) Suspension and precipitation states of the Live cells, BLPs and NPNs. Equal amounts of L. sakei cells (4 mL, OD600 = 1) were treated as live cells, BLPs, and NPNs, respectively. Resuspension status of each (100 μL) was observed in PCR tubes. (F) The OD600 value of live cells, BLPs, and NPNs. Equal amounts of L. sakei cells (1 mL, OD600 = 1) were treated as BLPs and NPNs for measurement. Data are mean ± SD (n = 3). (G) Particle size measurements of live cells, BLPs, and NPNs determined from TEM images using ImageJ. Over 30 particles were analyzed per group. Data are mean ± SD (n > 30). (H) Overview and morphology of live cells, BLPs, and clean NPNs observed by optical microscopy and transmission electron microscopy. Statistical significance was determined using the Student’s t test in GraphPad Prism.
Figure 3
Figure 3
Preparation and functional test of NPN-sHA1. (A) Schematic representation of recombinant sHA1 constructs in the pTEX1L binary vector. HDEL, ER retention signal; sHA1, HA gene from swine H1N1; SP, the signal peptide of AtBIP1. (B) SDS-PAGE and western blot analysis of sHA1–FD–SCpl7 expression in Nicotiana benthamiana. Target proteins were transiently expressed and harvested at 3, 5, and 7 DPI. Red arrowhead indicates the target protein band. (C and D) SDS-PAGE and CBB staining analysis of sHA1–FD–SCpl7. A BSA gradient (0.5, 1, 1.5, and 2 μg) was loaded for standard curve generation. Expression with or without co-expression of the chaperone CRT was compared. Results are shown in (D). Data are mean ± SD (n = 3). NT, non-treated plants. The red arrowhead indicates the target proteins. Statistical significance was determined using the Student’s t test in GraphPad Prism. (E) SDS-PAGE and CBB staining of NPN-conjugated sHA1–FD–SCpl7. Total protein extracts from increasing amounts of infiltrated leaf tissue (0.02, 0.04, 0.06, 0.08, 0.1, 0.12, 0.14, 0.16, 0.18, and 0.2 g) were incubated with equal amounts of NPNs. The pellets after incubation were separated by SDS-PAGE and subjected to CBB analysis. Varying amounts of BSA (0.5, 1, 1.5, and 2 μg) were loaded on the same gel for standard curve generation. The black arrowhead indicates that sHA1–FD–SCpl7 protein extracted from 0.06 g of fresh leaf tissue can saturably bind NPNs prepared from 1 mL of L. sakei culture (OD600 = 1). (F) The level of NPN-conjugated sHA1-FD-SCpl7 protein extracted from 0.06 g to 0.2 g of fresh leaf tissue is saturated, as shown in Figure 3E. The eight bands were quantified using ImageJ, and the mean values were calculated. (G) Cryo-EM of NPN-sHA1. PGN, peptidoglycan. The black arrowheads indicate sHA1–FD–SCpl7 trimers presented on the surface of NPNs. Representative sHA1–FD–SCpl7 trimers are shown in black dashed boxes. EX, expanded. (H and I) (H) Schematic of the immunization protocol. Five B5 mice per group were injected intramuscularly with 0.5 μg of soluble sHA1, BLP-sHA1, NPN-sHA1, or control treatments (PBS, BLPs, or NPNs), followed by a booster at 2-weeks. Mice sera were collected before and after immunization to determine humoral immune responses. Endpoint IgG antibody titers were measured by ELISA using plates coated with soluble sHA1–FD–SCpl7 protein (I). Dotted lines indicate the positive cutoff value, calculated as the mean endpoint titer of the PBS group. Statistical differences were determined by two-way ANOVA followed by Tukey’s multiple comparisons tests. ∗p < 0.05; ∗∗p < 0.01; ∗∗∗p < 0.001; ∗∗∗∗p < 0.0001. Error bars represent SEM.
Figure 4
Figure 4
NPN-rGFP remains in muscular tissue longer and induces GFP-specific polyclonal antibodies (A) Schematic overview of the immunization protocol and GFP-specific antibody analysis. BALB/c mice (n = 3 per group) were intramuscularly immunized with 1 μg of soluble rGFP, BLP-rGFP, or NPN-rGFP or an equivalent volume of control (PBS, BLP, or NPN), followed by a booster at 2 weeks. Sera were collected after immunization to determine GFP polyclonal antibody production via western blot. Samples loaded on the SDS-PAGE included total protein from live cells (1), BLP s(2), NPNs (3), NT (4), and GFP-FD-LLysM (GFP-FD-LLysM infiltrated plants) (5). (B–H) Western blot analysis of samples using a commercial anti-His antibody (B) and sera collected from mice immunized with PBS (C), BLPs (D), NPNs (E), soluble rGFP (F), BLP-rGFP (G), and NPN-rGFP (H). Red asterisks indicate the bands of GFP–FD–LLysM. (Iand J) Injection and imaging procedure. Equal doses (5 μg) of soluble rGFP and NPN-rGFP were injected into the muscular tissue of the mouse leg (I). Intramuscular GFP signals were captured using a Leica fluorescence microscope (Z16 APO A) equipped with a mercury lamp as the excitation source and a monochromatic camera (DMC6200). The shank-feathering-removed mouse was anesthetized with isoflurane during observation, and its hairless leg was fixed using a scaffold for imaging(J). (K) Temporal tracking of GFP signal post-injection captured at 0, 1, 3, 6, 10, and 24 h. Scale bars, 2 mm.
Figure 5
Figure 5
NPN production and its conjugation process to plant-derived antigens. (A) NPNs were prepared from live lactic acid bacteria (LAB) through sequential treatment with 10% trichloroacetic acid and trypsin. (B) Codon-optimized foreign genes were efficiently expressed in N. benthamiana via Agrobacterium-mediated transient transformation. Harvested leaves were homogenized in extraction buffer, filtered through Miracloth, and centrifuged three times to obtain TSPs. GOI, gene(s) of interest encoding antigens; PA, protein anchors. (C) Purified NPNs were incubated with TSP at 4°C for 15 min. The mixture was then filtered to collect antigen-displayed NPNs and washed three times to generate NPN-conjugated vaccine complexes.

Similar articles

References

    1. Andey T., Soni S., Modi S. In: Advanced Vaccination Technologies for Infectious and Chronic Diseases. Chavda V.P., Vora L.K., Apostolopoulos V., editors. Academic Press; 2024. Chapter 3 - Conventional vaccination methods: Inactivated and live attenuated vaccines; pp. 37–50.
    1. Bermúdez-Humarán L.G., Aubry C., Motta J.-P., Deraison C., Steidler L., Vergnolle N., Chatel J.-M., Langella P. Engineering lactococci and lactobacilli for human health. Curr. Opin. Microbiol. 2013;16:278–283. - PubMed
    1. Bi J., Li F., Zhang M., Wang H., Lu J., Zhang Y., Ling H., Wang J., Gao F., Kong W., et al. An HIV-1 vaccine based on bacterium-like particles elicits Env-specific mucosal immune responses. Immunol. Lett. 2020;222:29–39. - PubMed
    1. Bosma T., Kanninga R., Neef J., Audouy S.A.L., Van Roosmalen M.L., Steen A., Buist G., Kok J., Kuipers O.P., Robillard G., Leenhouts K. Novel Surface Display System for Proteins on Non-Genetically Modified Gram-Positive Bacteria. Appl. Environ. Microbiol. 2006;72:880–889. - PMC - PubMed
    1. Chung Y.H., Church D., Koellhoffer E.C., Osota E., Shukla S., Rybicki E.P., Pokorski J.K., Steinmetz N.F. Integrating plant molecular farming and materials research for next-generation vaccines. Nat. Rev. Mater. 2022;7:372–388. - PMC - PubMed

LinkOut - more resources