Review
. 2025 Jun;28(6):e70135.
doi: 10.1111/ele.70135.

Deadly Decomposers: Distinguishing Life History Strategies on the Parasitism-Saprotrophy Spectrum

Affiliations
Review

Deadly Decomposers: Distinguishing Life History Strategies on the Parasitism-Saprotrophy Spectrum

Daniel C G Metz et al. Ecol Lett. 2025 Jun.

Abstract

The ability to parasitize living hosts as well as decompose dead organic matter is both common and widespread across prokaryotic and eukaryotic taxa. These parasitic decomposers have long been considered merely accidental or facultative parasites. However, this is often untrue: in many cases, parasitism is integral to the ecology and evolution of these organisms. Combining life cycle information from the literature with a generalised eco-evolutionary model, we define four distinct life history strategies followed by parasitic decomposers. Each strategy has a unique fitness expression, life cycle, ecological context, and set of evolutionary constraints. Correctly classifying parasitic decomposers is essential for understanding their ecology and epidemiology and directly impacts efforts to manage important medical and agricultural pathogens.

Keywords: biotroph‐necrotroph spectrum; entomopathogens; evolution of parasitism; facultative parasites; life history; nosocomial diseases; opportunistic pathogens; sapronosis; trade‐offs.


Conflict of interest statement

The authors declare no conflicts of interest.

Figures

FIGURE 1
FIGURE 1
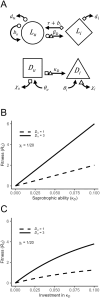
Parasaprotrophs. (A) A flow diagram shows how organisms using the parasaprotroph strategy can both infect living hosts and infest dead organic substrates using a variety of pathways. Uninfected living hosts (Lu) can become infected hosts (Li) by exposure to infectious propagules arising from either parasaprotroph‐infested dead organic substrates (Di) or infected hosts (Li) at the rates βD (dead‐to‐host transmission) and βL (host‐to‐host transmission), respectively. If vertical transmission is possible (ε>0), infected hosts (Li) can give birth to new infected hosts at the rate εbi. Both infected and uninfected hosts can produce dead uninfested substrate (Du) either by shedding dead material (νiu or νu) or dying (ω1γdi or ωdu). Infected hosts can also directly generate infested dead substrate, either by shedding already infested dead matter (νii) or by dying and having the cadaver colonised by the already‐present parasaprotoph (ωγdi). Infected live hosts (Li) can produce propagules that colonise uninfested dead substrate (Du), converting it to infested substrate (Di) at the living‐to‐dead transmission rate κL. Propagules from infested dead substrate (Di) can also colonise uninfested substrate (Du) at the dead‐to‐dead transmission rate κD. Live uninfected and infected hosts die (du, di) and give birth to uninfected offspring (bu or 1εbi). Infected hosts (Li) can recover from infection (r). Uninfested and infested dead substrates (Du and Di) can replenish from some external source (θu and θi) and decay (χu and χi). Shapes at the tail of each arrow correspond to the shape of each state variable (Lu,Li,Du, or Di) and indicate which variable(s) are multiplied by the rate associated with the arrow to generate a transition to a new state (see Table 2 for parameter definitions). (B) Transmission trade‐offs assumed for numerical evaluation of the fitness equation (Equation 5) are shown as functions of saprotrophic ability (dead‐to‐dead transmission κD). Assuming trade‐offs take the form y=ymaxeκDs2, where y is the parameter value, ymax is its value when κD=0, and s is some shape parameter, then the strength of the trade‐off between κD and the parameter in question is determined by s. For “weak” trade‐offs, the value of s was 5 for βL and κL and 10 for βD. For “strong” trade‐offs, the value of s was 15 for βL and κL and 10 for βD. ymax=0.1 for all. Overlapping curves for βL (red) and κL (black) are offset for visualisation. (C) Fitness components of the parasaprotroph life cycle (Equation 6) vary with investment in saprotrophic ability (dead‐to‐dead transmission κD). Curves displayed in this panel correspond to “strong” trade‐offs (dashed lines in panels B and D). The fitness components are saprotrophy (R0DD), parasitism (R0LL), infection of live hosts from infested dead material (R0LD), and infestation of dead material from live hosts (R0DL). When the full invasion expression (Equations 5 and 6) is evaluated (as in panel D), these components combine to produce whole‐life‐cycle fitness curves across a range of saprotrophic ability. (D) Numerical solutions to the invasion fitness expression (Equation 5) across a range of dead‐to‐dead transmission values (saprotrophic ability κD) show that selection can favour the maintenance of “mixed” life history strategies utilising a balance of parasitism and saprotrophy. If trade‐offs with βL and κL are strong (dashed line), investment in parasitism (and reduced investment in saprotrophic ability κD) may be favoured over investment in saprotrophy (asterisk indicates greatest R0). If these trade‐offs are weak (solid line), a more mixed strategy is possible (dagger indicates greatest R0). The strength of the trade‐off between κD and βD also influences the combinations of parameter values associated with an R0 optimum, with weak trade‐offs favouring investment in saprotrophy (κD). Lu=1,Du=1,K=10,000,r=1/7,di=1/20,ε=0,bi=1/6,ω=1,γ=1/4,χi=1,νii=1.
FIGURE 2
FIGURE 2
Opportunistic sapronotic agents. (A) A flow diagram shows how organisms using the opportunistic sapronosis strategy can only produce infections in live hosts from the decomposition part of the life cycle. Refer to the caption for Figure 1 for a detailed description of the transitions evident in this life cycle, and see Table 2 for parameter definitions. (B) Numerical solutions to the invasion fitness expression (Equation 7) show that, because infections cannot contribute to fitness, investment in greater saprotrophic ability (the dead substrate to dead substrate transmission rate κD) is always favoured. Increasing the abundance or quality of dead substrate (Di) (solid line) increases the per‐unit payoff of investment in κD. (C) If investment in κD is a saturating function (here represented as κD=κD,maxeinvestmentκDs2, where κD,max=0.1 and s=5), then there may be little cost to maintaining some level of parasitic ability at the expense of saprotrophic ability (κD) if investment in saprotrophic ability is saturated.
FIGURE 3
FIGURE 3
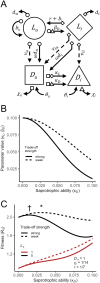
Adapted sapronotic agents. (A) A flow diagram shows how organisms using the adapted sapronosis strategy can only infect live hosts via transmission from decomposers, but infected hosts can themselves contribute to the decomposer cycle. Refer to the caption for Figure 1 for a detailed description of the transitions evident in this life cycle, and see Table 2 for parameter definitions. (B) Assuming parameter trade‐offs take the form y=ymaxeκDs2, where y is the parameter value, ymax is its value when κD=0, and s is some shape parameter, then the strength of the trade‐off between κD and either κL or βD is determined by s. The value of s was 10 for “weak” trade‐offs and 15 for “strong” trade‐offs. (C) Numerical solutions to the invasion fitness expression (Equation 8) show that, if abundance or quality of live hosts (Lu) is low relative to that of dead substrate (Du) (red lines), saprotrophy is likely favoured regardless of trade‐off strength. However, when live host abundance or quality is high, the contribution of parasitism to the life cycle increases to the point where selection favours sacrificing some saprotrophic ability to enhance parasitism. Adapted sapronoses thus become possible (black lines). When adapted sapronosis is possible, strong trade‐offs (solid line) favour less investment in saprotrophic ability κD and more investment in live to dead transmission κL or dead to live transmission βD (dagger). Weaker trade‐offs (dashed line) permit reduced investment in κL or βD and increased saprotrophic ability (κD) (asterisk). Parameters not listed in figure: di=1/30,νii=0.
FIGURE 4
FIGURE 4
Saprotrophic parasitoids. (A) While they must infect a living host (Lu,Li) to complete their life cycle, saprotrophic parasitoids require a dead host body (Di) within which to develop and produce propagules. Refer to the caption for Figure 1 for a detailed description of the transitions evident in this life cycle, and see Table 2 for parameter definitions. (B) We assume a positive association between cadaver exploitation (dead substrate removal rate χi) and transmission to live hosts (βD) modelled as βD,min+βD,max1+esχi2. βD,max is the asymptotic maximum of βD (set to 2), while βD,min is the value of βD when χi is zero (set to 0.01). The shape parameter s was 1 for a weak association (dashed line) and 2 for a strong association (solid line). (C) Numerical solutions to the invasion fitness expression (Equation 9) show that R0 is maximised (asterisk) at a moderate exploitation rate if the association is strong (solid line), while a weaker association favours faster exploitation (dashed line). As indicated by the sharp increase in R0 as χi approaches 0, any amount of transmission at very low levels of χi could favour a “cadaver preservation” strategy. Parameter not listed in figure: ω=1.

Similar articles

References

    1. Abang, M. M. , Baum M., Ceccarelli S., et al. 2006. “Differential Selection on Rhynchosporium Secalis During Parasitic and Saprophytic Phases in the Barley Scald Disease Cycle.” Phytopathology 96: 1214–1222. - PubMed
    1. Ahuatzin‐Flores, O. E. , Torres E., and Chávez‐Bravo E.. 2024. “ <styled-content style="fixed-case"> Acinetobacter baumannii </styled-content>, A Multidrug‐Resistant Opportunistic Pathogen in New Habitats: A Systematic Review.” Microorganisms 12: 644. - PMC - PubMed
    1. Akinsanmi, O. A. , Chakraborty S., Backhouse D., and Simpfendorfer S.. 2007. “Passage Through Alternative Hosts Changes the Fitness of Fusarium Graminearum and Fusarium Pseudograminearum.” Environmental Microbiology 9: 512–520. - PubMed
    1. Almagro‐Moreno, S. , and Taylor R. K.. 2013. “Cholera: Environmental Reservoirs and Impact on Disease Transmission.” Microbiology Spectrum 1. 10.1128/microbiolspec.oh-0003–2012. - DOI - PubMed
    1. Andersen, S. B. , Gerritsma S., Yusah K. M., et al. 2009. “The Life of a Dead Ant: The Expression of an Adaptive Extended Phenotype.” American Naturalist 174: 424–433. - PubMed

LinkOut - more resources