. 2025 May 30;14(5):1327-1347.
doi: 10.21037/tau-2024-677. Epub 2025 May 27.

Identification of core genes in acute kidney injury: evidence from multi-omics human transcriptomic data and in vivo models

Affiliations

Identification of core genes in acute kidney injury: evidence from multi-omics human transcriptomic data and in vivo models

Pengxiao Sun et al. Transl Androl Urol. .

Abstract

Background: Acute kidney injury (AKI) affects up to 23.2% of hospitalized patients, but its complex pathophysiology hinders diagnosis and treatment. Bioinformatics-driven identification of core genes from large-scale omics data offers a promising approach for uncovering diagnostic and therapeutic targets. This study aims to integrate multi-omics data with experimental validation to identify core genes involved in AKI and explore their mechanisms.

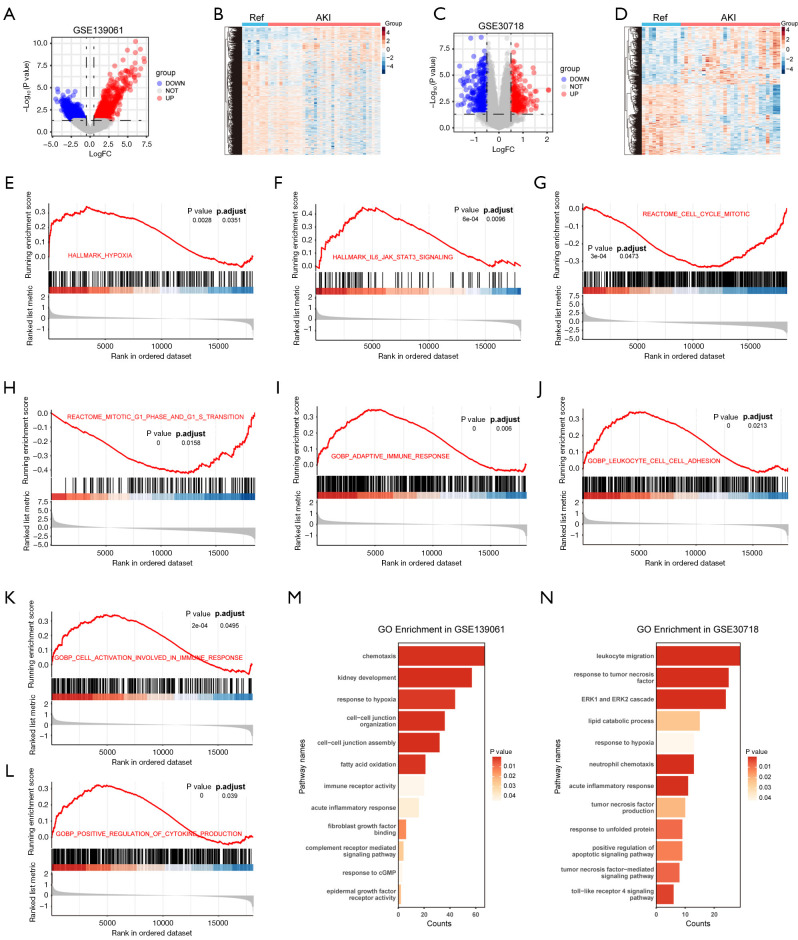
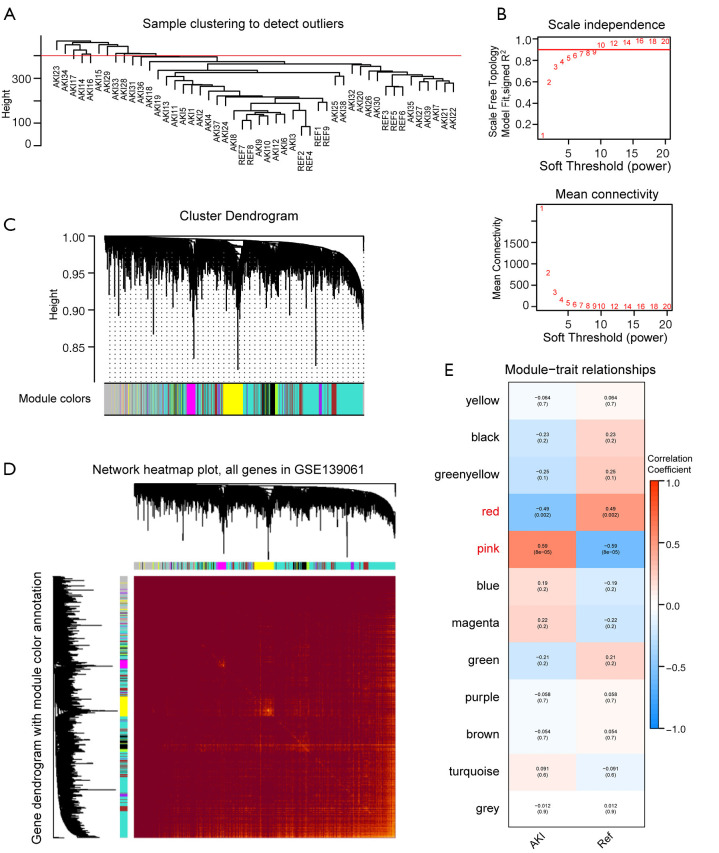
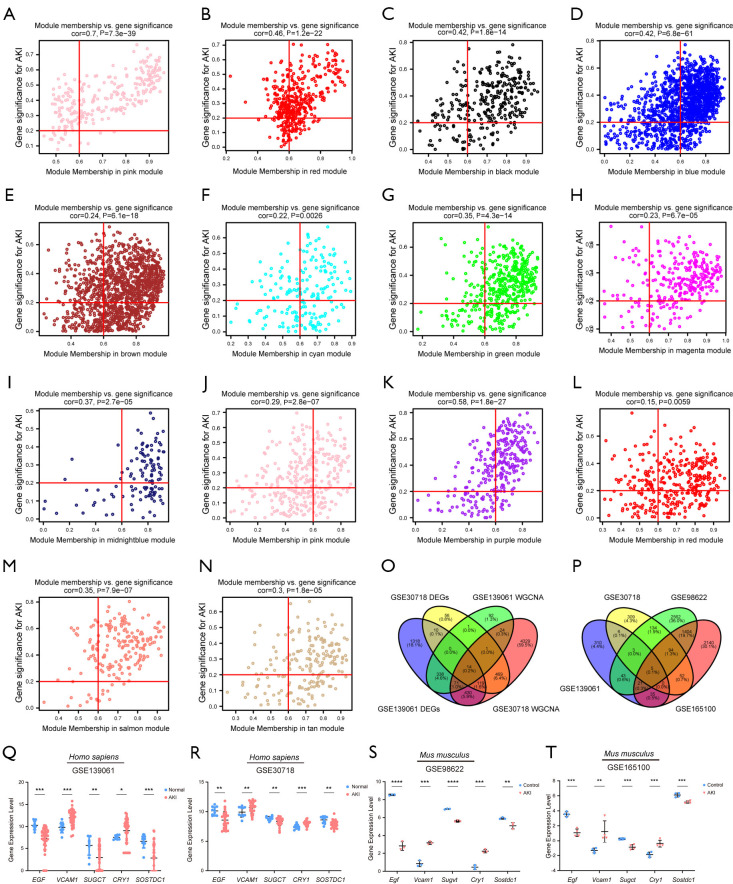
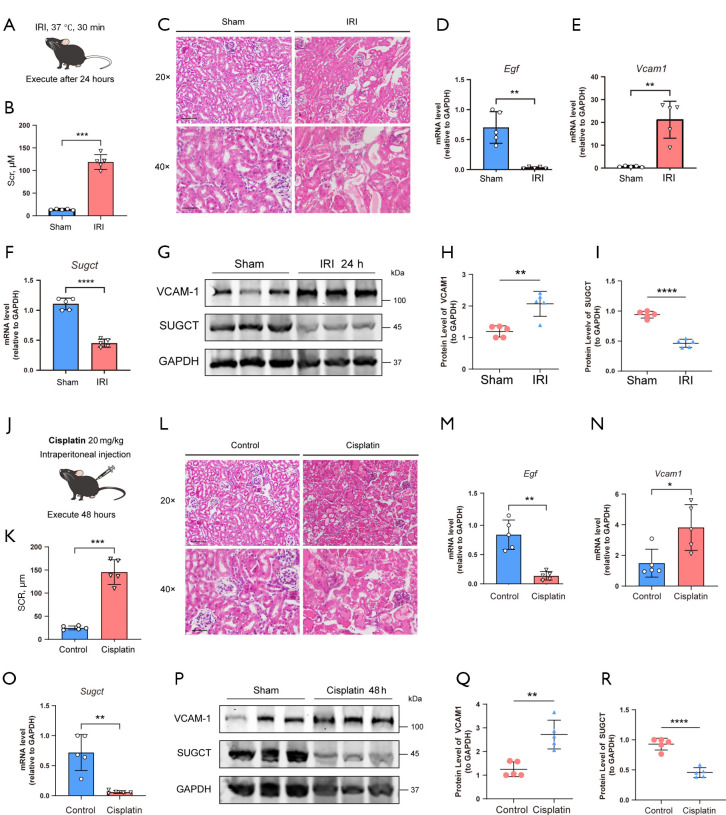
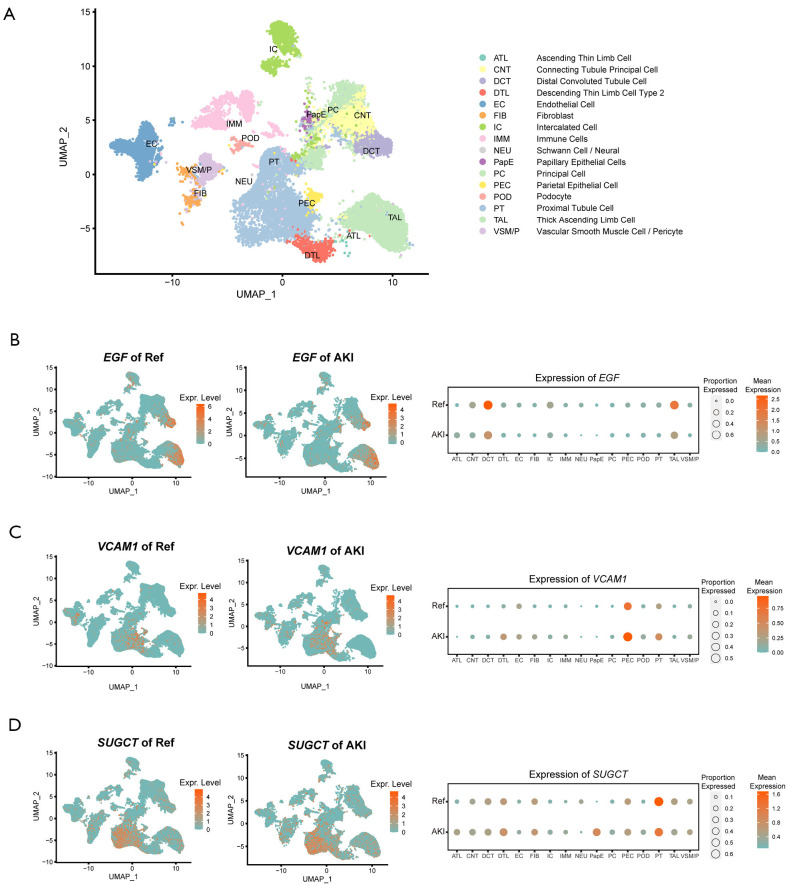
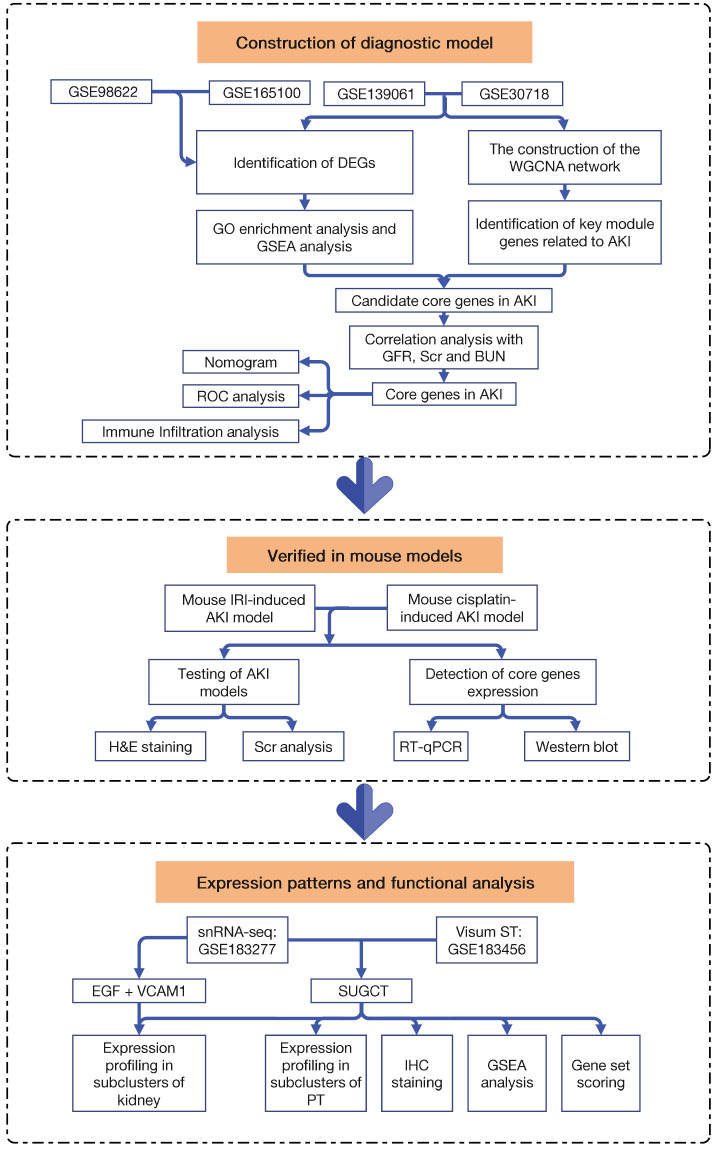
Methods: We analyzed renal transcriptomic data from 67 AKI patients and 20 controls, integrating differential expression, weighted gene co-expression network analysis (WGCNA), and clinical correlations to identify key genes. A nomogram model was used to assess diagnostic performance, and immune microenvironment characteristics were analyzed using CIBERSORT. AKI was induced in mice by ischemia-reperfusion and cisplatin, with gene expression validated by reverse transcription real-time quantitative polymerase chain reaction (RT-qPCR), Western blot, and immunohistochemistry. SUGCT expression and function were further examined in proximal tubules (PT) using human single-nucleus RNA sequencing (snRNA-seq) and spatial transcriptomics.

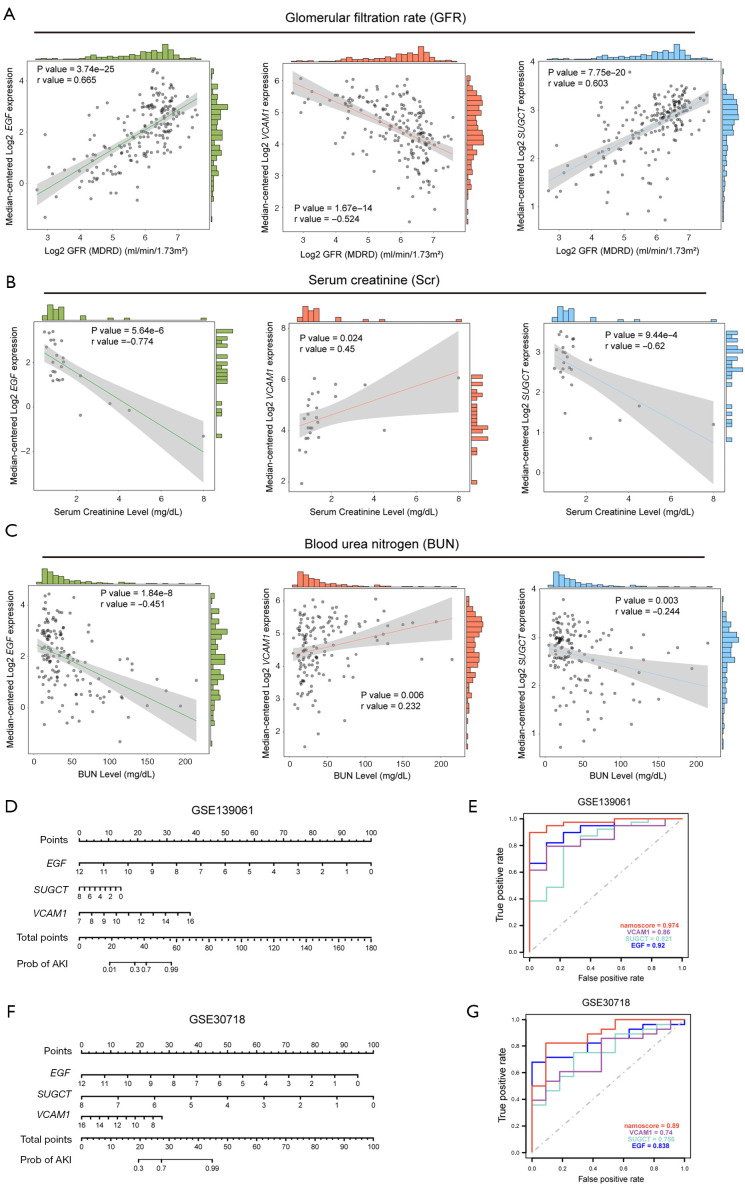
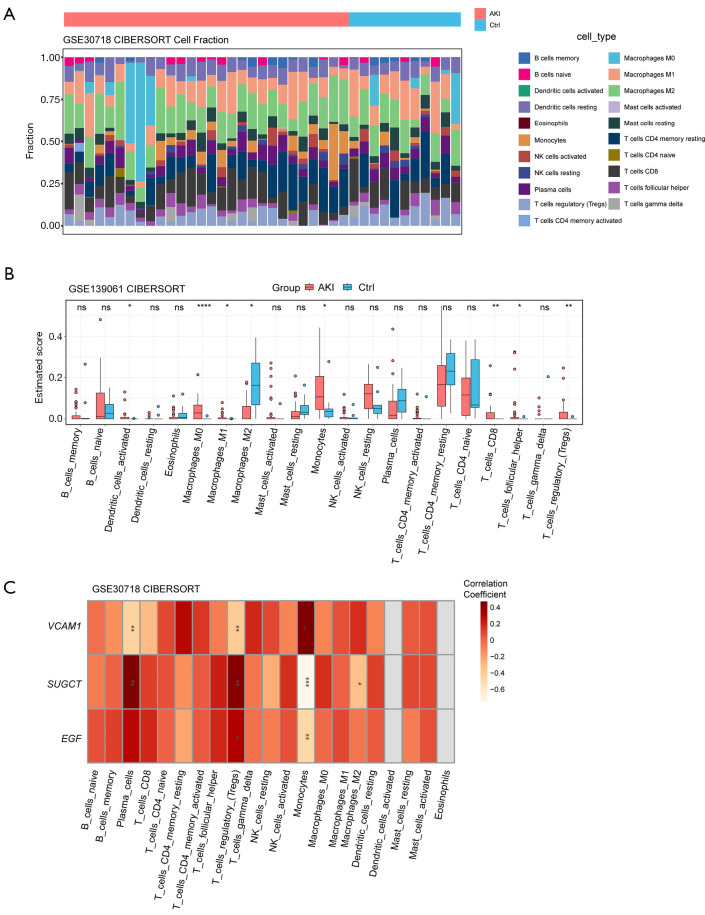
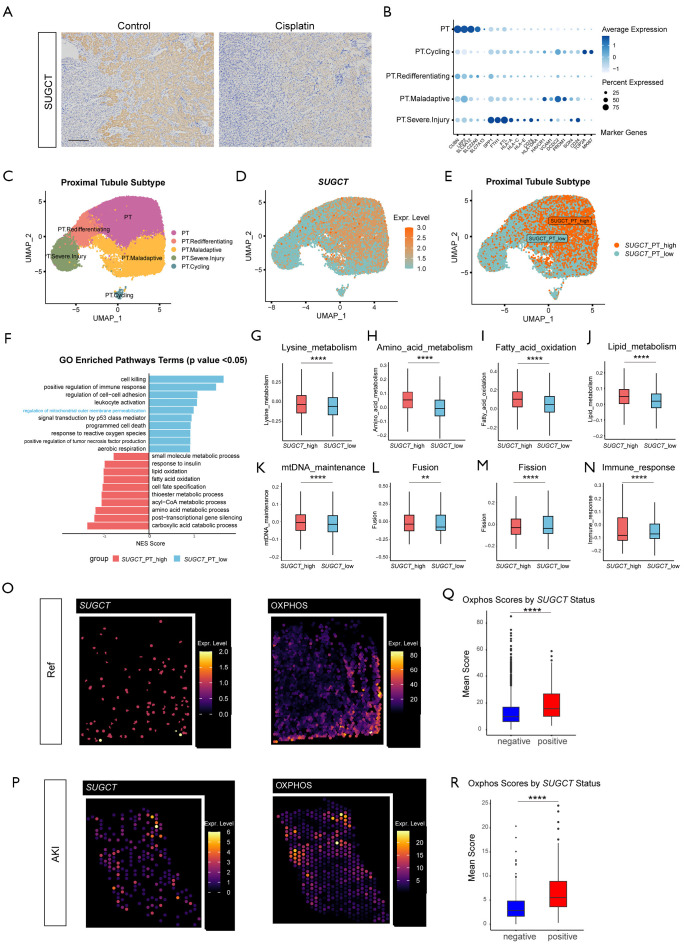
Results: Three core genes, epidermal growth factor (EGF), vascular cell adhesion molecule 1 (VCAM1), and SUGCT, were identified, showing significant associations with AKI phenotypes and clinical renal parameters. Combined, these genes provided a robust diagnostic model for AKI. CIBERSORT associated VCAM1 with monocytes, SUGCT with monocytes and M2 macrophages, and EGF with monocytes and T cells. Both mouse models showed downregulation of Sugct and Egf, and upregulation of Vcam1, consistent with human data. Single-nucleus RNA sequencing revealed that SUGCT was highly expressed in healthy PT but downregulated in severely injured PT. Low SUGCT expression correlated with suppressed mitochondrial functions and activated immune responses. Spatial transcriptomics confirmed that regions of high SUGCT expression co-localized with areas of oxidative phosphorylation activity in PT.

Conclusions: This study highlights three core genes of AKI, especially SUGCT, which is related to mitochondrial metabolism and immune balance in PT during AKI, offering potential diagnostic and therapeutic targets.

Keywords: Acute kidney injury (AKI); SUGCT; inflammation; mitochondria; weighted gene co-expression network analysis (WGCNA).


Conflict of interest statement

Conflicts of Interest: All authors have completed the ICMJE uniform disclosure form (available at https://tau.amegroups.com/article/view/10.21037/tau-2024-677/coif). J.N. reports that this work was supported by grants from the Nature and Science Foundation of China (Nos. 82090023 and 82330019), Guangdong Basic and Applied Basic Research Foundation (No. 2019B1515120075), National High Level Hospital Clinical Research Funding (Scientific Research Fund of Peking University First Hospital) (No. 2023IR16), and Research Project in State Key Laboratory of Vascular Homeostasis and Remodeling (Peking University) (No. 24QZ003). The other authors have no conflicts of interest to declare.

Figures

Figure 1
Figure 1
Data processing and identification of the DEGs in AKI. (A) Volcano plot showing DEGs between AKI and reference controls in GSE139061. (B) Heatmap indicating DEGs between AKI and reference controls in GSE139061. (C) Volcano plot showing DEGs between AKI and reference controls in GSE30718. (D) Heatmap indicating DEGs between AKI and reference controls in GSE30718. (E-L) GSEA analysis. (M) GO enrichment analysis of GSE139061. (N) GO enrichment analysis of GSE30718. AKI, acute kidney injury; DEGs, differentially expressed genes; FC, fold change; GSEA, Gene Set Enrichment Analysis; GO, Gene Ontology; Ref, reference controls.
Figure 2
Figure 2
Filtering the gene modules by constructing WGCNA using the GSE139061 dataset. (A) Sample clustering tree. The red line indicates the cut height applied to remove outlier samples. (B) Analysis of network topology for various soft-threshold powers. The upper panel shows the function of soft-threshold power on the scale-free topology fit index; the lower panel displays the function of soft-threshold power on the mean connectivity. R2=0.90. (C) Gene tree diagram based on the measurement of dissimilarity with branch colors representing the gene modules identified. (D) Heatmap plot of topological overlap in the gene network. In the heatmap, each row and column correspond to a gene, darker red denotes low topological overlap, and progressively light color denotes higher topological overlap. Alongside, the gene dendrogram and module assignment are displayed along the left and top of the heatmap. (E) Heatmap showing the correlation between module eigengenes and the AKI phenotype. The numbers in each cell represent the correlation coefficient and P value. AKI, acute kidney injury; Ref, reference controls; WGCNA, weighted gene co-expression network analysis.
Figure 3
Figure 3
Acquisition of candidate core genes based on the AKI-related modules. (A,B) Core gene screening of the AKI-related modules in the GSE139061 dataset. (C-N) Core gene screening of the AKI-related modules in the GSE30718 dataset. (O) Identification of common genes combined WGCNA with DEGs of GSE139061 and GSE30718 dataset. (P) Identification of candidate core genes combined common genes (O) with DEGs of GSE98622 and GSE165100. (Q) Expression of 5 candidate core genes in GSE139061. (R) Expression of 5 candidate core genes in GSE30718. (S) Expression of 5 candidate core genes in GSE98622. (T) Expression of 5 candidate core genes in GSE165100. *, P<0.05; **, P<0.01; ***, P<0.001; ****, P<0.0001. AKI, acute kidney injury; cor, correlation; DEGs, differentially expressed genes; EGF, epidermal growth factor; VCAM1, vascular cell adhesion molecule 1; WGCNA, weighted gene co-expression network analysis.
Figure 4
Figure 4
Clinical diagnostic value and correlation analysis of candidate core genes with renal function parameters. (A) Correlation analysis of EGF, VCAM1 and SUGCT with GFR. (B) Correlation analysis of EGF, VCAM1 and SUGCT with Scr. (C) Correlation analysis of EGF, VCAM1 and SUGCT with BUN. (D) The nomogram based on three core genes in GSE139061. (E) ROC curves of VCAM1, SUGCT, EGF and three genes as a gene signature in GSE139061. (F) The nomogram based on three core genes in GSE30718. (G) ROC curves of VCAM1, SUGCT, EGF and three genes as a gene signature in GSE30718. BUN, blood urea nitrogen; GFR, glomerular filtration rate; EGF, epidermal growth factor; ROC, receiver operating characteristic; Scr, serum creatinine; VCAM1, vascular cell adhesion molecule 1.
Figure 5
Figure 5
Analysis and correlation of core genes with immune infiltration in AKI. (A) Immune infiltration proportions of 21 immune cell types across different individuals. (B) Infiltrated abundance of immune cells in AKI and normal samples. (C) Correlation heatmap depicting the relationship between immune cell infiltration and three core genes. ns, no significance; *, P<0.05; **, P<0.01; ***, P<0.001; ****, P<0.0001. AKI, acute kidney injury; Ctrl, control; EGF, epidermal growth factor; NK, natural killer; VCAM1, vascular cell adhesion molecule 1.
Figure 6
Figure 6
Construction of AKI mouse models for in vivo validation of core genes expression alteration. (A) Experimental design. WT mice underwent renal pedicle clamping for 30 minutes to induce ischemia, followed by reperfusion to restore blood flow. Mice were sacrificed 24 hours after reperfusion. (B) Scr levels in the IRI model and sham group (n=5). (C) Representative images of H&E staining of kidney tissues in the IRI model and sham group are shown. Scale bar (upper) =100 μm; scale bar (lower) =50 μm. (D-F) Relative mRNA expression of Egf, Vcam1, Sugct in the IRI and the sham group (n=5). (G-I) Western blot analysis and densitometric quantification of SUGCT and VCAM1 after surgery (n=5). (J) Experimental design. WT mice received a single intraperitoneal injection of cisplatin (20 mg/kg) for 2 days to induce cisplatin-induced AKI model. (K) Scr levels in the cisplatin model and control group (n=5). (L) Representative images of H&E staining of kidney tissues in the cisplatin model and control group are shown. Scale bar (upper) =100 μm; scale bar (lower) =50 μm. (M-O) Relative mRNA expression of Egf, Vcam1, Sugct in the cisplatin and the control group (n=5). (P-R) Western blot analysis and densitometric quantification of SUGCT and VCAM1 after cisplatin exposure (n=5). *, P<0.05; **, P<0.01; ***, P<0.001; ****, P<0.0001. AKI, acute kidney injury; H&E, hematoxylin and eosin; IRI, ischemia-reperfusion injury; Sham, sham surgery; Scr, serum creatinine; VCAM1, vascular cell adhesion molecule 1; WT, wild-type.
Figure 7
Figure 7
Single-nucleus RNA sequencing analysis of core genes distribution and expression in AKI. (A) Reference UMAP plot. Cells were categorized and annotated into distinct cell types. (B) Density plots of EGF in Ref and AKI samples (left). A dot plot illustrating the expression levels of EGF across different groups (right). (C) Density plots of VCAM1 in Ref and AKI samples (left). Dot plots illustrating the expression levels of VCAM1 across different groups (right). (D) Density plots of SUGCT in Ref and AKI samples (left). Dot plots illustrating the expression levels of SUGCT across different groups (right). AKI, acute kidney injury; Expr. Level, expression level; EGF, epidermal growth factor; Expr. Level, expression level; Ref, reference; UMAP, uniform manifold approximation and projection; VCAM1, vascular cell adhesion molecule 1.
Figure 8
Figure 8
Combined single nucleus RNA sequencing and spatial transcriptome analysis reveal the expression distribution and function of SUGCT in AKI. (A) Representative images of immunohistochemical staining for SUGCT in kidney sections after cisplatin exposure. Scale bar =200 μm. (B) Dot plot of marker genes expression of PT subclusters. (C) UMAP of PT subclusters. (D) Density plot illustrating SUGCT expression within the PT subclusters. (E) UMAP showing proximal tubule cells stratified into high and low expression groups based on SUGCT levels. (F) GO enrichment of PT-SUGCT-low and PT-SUGCT-high group. (G-N) Score of mitochondrial pathways between the PT-SUGCT-low and PT-SUGCT-high group. (O) Feature plots of SUGCT and OXPHOS scores in spatial organization of PT in Ref sample. (P) Feature plots of SUGCT and OXPHOS scores in spatial organization of PT in AKI sample. (Q) Bar charts showing the differences in the OXPHOS score between SUGCT positive and negative groups in Ref sample. (R) Bar charts showing the differences in the OXPHOS score between SUGCT positive and negative groups in AKI sample. **, P<0.01; ****, P<0.0001. AKI, acute kidney injury; Expr. Level, expression level; GO, Gene Ontology; OXPHOS, oxidative phosphorylation; PT, proximal tubules; Ref, reference; UMAP, uniform manifold approximation and projection.
Figure 9
Figure 9
Flow chart of the research study. AKI, acute kidney injury; BUN, blood urea nitrogen; DEGs, differentially expressed genes; EGF, epidermal growth factor; GFR, glomerular filtration rate; GO, Gene Ontology; GSEA, Gene Set Enrichment Analysis; H&E, hematoxylin and eosin; IHC, immunohistochemical; IRI, ischemia-reperfusion injury; PT, proximal tubules; ROC, receiver operating characteristic; RT-qPCR, reverse transcription real-time quantitative polymerase chain reaction; Scr, serum creatinine; snRNA-seq, small nuclear RNA-sequencing; VCAM1, vascular cell adhesion molecule 1; WGCNA, weighted gene co-expression network analysis.

Similar articles

References

    1. Scholz H, Boivin FJ, Schmidt-Ott KM, et al. Kidney physiology and susceptibility to acute kidney injury: implications for renoprotection. Nat Rev Nephrol 2021;17:335-49. 10.1038/s41581-021-00394-7 - DOI - PubMed
    1. Susantitaphong P, Cruz DN, Cerda J, et al. World incidence of AKI: a meta-analysis. Clin J Am Soc Nephrol 2013;8:1482-93. Erratum in: Clin J Am Soc Nephrol 2014;9:1148. 10.2215/CJN.00710113 - DOI - PMC - PubMed
    1. See EJ, Jayasinghe K, Glassford N, et al. Long-term risk of adverse outcomes after acute kidney injury: a systematic review and meta-analysis of cohort studies using consensus definitions of exposure. Kidney Int 2019;95:160-72. 10.1016/j.kint.2018.08.036 - DOI - PubMed
    1. Brown N, Roman M, Miller D, et al. A Systematic Review and Meta-Analysis of MicroRNA as Predictive Biomarkers of Acute Kidney Injury. Biomedicines 2024;12:1695. 10.3390/biomedicines12081695 - DOI - PMC - PubMed
    1. Waikar SS, Betensky RA, Bonventre JV. Creatinine as the gold standard for kidney injury biomarker studies? Nephrol Dial Transplant 2009;24:3263-5. 10.1093/ndt/gfp428 - DOI - PubMed

LinkOut - more resources