Migrasome-related lncRNAs predict prognosis and immune response of clear cell renal cell carcinoma
- PMID: 40529029
- PMCID: PMC12170270
- DOI: 10.21037/tau-2024-728
Migrasome-related lncRNAs predict prognosis and immune response of clear cell renal cell carcinoma
Abstract
Background: Clear cell renal cell carcinoma (ccRCC) is the most common and aggressive renal malignancy. Migrasomes, newly discovered organelles involved in intercellular communication, and long non-coding RNAs (lncRNAs) are emerging regulators of cancer progression. However, the role of migrasome-associated lncRNAs in ccRCC prognosis and immune response remains unclear. This study aimed to investigate the value of migrasome-related lncRNAs and develop a risk model for ccRCC.
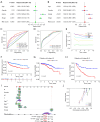
Methods: By employing data from The Cancer Genome Atlas, we were able to identify prognostically significant migrasome-related lncRNAs through co-expression analysis, Cox regression, and least absolute shrinkage and selection operator (LASSO) regression. Prognostic models were developed and validated using these lncRNAs, and a nomogram combining the risk score with clinical features was constructed. Furthermore, our analyses encompassed gene set enrichment, immune infiltration, mutational burden, and drug sensitivity.
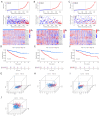
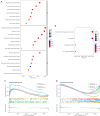
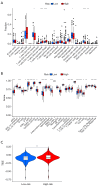
Results: A prognostic model incorporating 13 lncRNAs effectively stratified patients into distinct risk categories, with the high-risk cohort demonstrating markedly inferior survival rates. The prognostic accuracy was validated through multiple analyses. Gene enrichment analysis revealed a correlation between these lncRNAs and tumor development and immune pathways. High-risk patients exhibited increased immunosuppressive cell infiltration, oncogenic mutations, and potential for immune escape. Furthermore, they demonstrated a lack of response to immunotherapy and exhibited differential responses to antineoplastic agents when compared to low-risk patients. We propose a prognostic model for ccRCC based on migrasome-related lncRNAs, providing new insights into disease progression and potential individualized treatment strategies.
Conclusions: Our study proposes a prognostic model for ccRCC based on migrasome-related lncRNAs, providing new insights into disease progression and potential individualized treatment strategies.
Keywords: Migrasome; clear cell renal cell carcinoma (ccRCC); drug sensitivity; immune; prognosis.
Copyright © 2025 AME Publishing Company. All rights reserved.
Conflict of interest statement
Conflicts of Interest: All authors have completed the ICMJE uniform disclosure form (available at https://tau.amegroups.com/article/view/10.21037/tau-2024-728/coif). The authors have no conflicts of interest to declare.
Figures



Similar articles
-
Construction of a risk and prognostic model for migrasome-associated lncRNAs in renal cell carcinoma.Sci Rep. 2025 Jul 23;15(1):26760. doi: 10.1038/s41598-025-10630-w. Sci Rep. 2025. PMID: 40702098 Free PMC article.
-
Influence of migrasome-associated long noncoding RNAs on the immune microenvironment and prognosis in lung adenocarcinoma.Discov Oncol. 2025 Jun 20;16(1):1168. doi: 10.1007/s12672-025-03000-5. Discov Oncol. 2025. PMID: 40542304 Free PMC article.
-
Prognostic and therapeutic relevance of IL2RG-related LncRNAs in clear cell renal cell carcinoma.Sci Rep. 2025 Aug 13;15(1):29651. doi: 10.1038/s41598-025-15439-1. Sci Rep. 2025. PMID: 40804289 Free PMC article.
-
Senescence-Related LncRNAs: Pioneering Indicators for Ovarian Cancer Outcomes.Phenomics. 2024 Sep 26;4(4):379-393. doi: 10.1007/s43657-024-00163-z. eCollection 2024 Aug. Phenomics. 2024. PMID: 39583315 Free PMC article. Review.
-
Assessing the comparative effects of interventions in COPD: a tutorial on network meta-analysis for clinicians.Respir Res. 2024 Dec 21;25(1):438. doi: 10.1186/s12931-024-03056-x. Respir Res. 2024. PMID: 39709425 Free PMC article. Review.
References
LinkOut - more resources
Full Text Sources
