

Analysis of the burden of disease for male infertility globally and in China from 1990 to 2021
- PMID: 40529032
- PMCID: PMC12170198
- DOI: 10.21037/tau-2025-44
Analysis of the burden of disease for male infertility globally and in China from 1990 to 2021
Abstract
Background: Infertility affects one in six couples globally, with male infertility contributing to 50% of cases. Despite its high prevalence, male infertility is underexplored in some regions due to cultural and societal factors. Epidemiological data remain sparse and inconsistent. This study uses Global Burden of Disease (GBD) 2021 data to assess the global and Chinese burden of male infertility and project future trends.
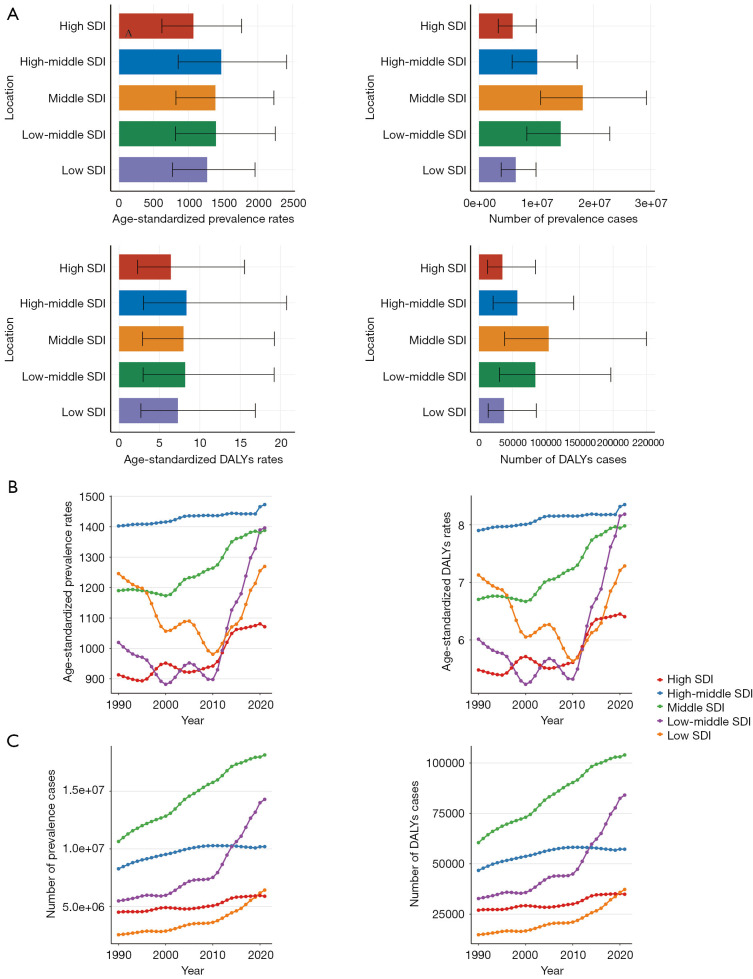
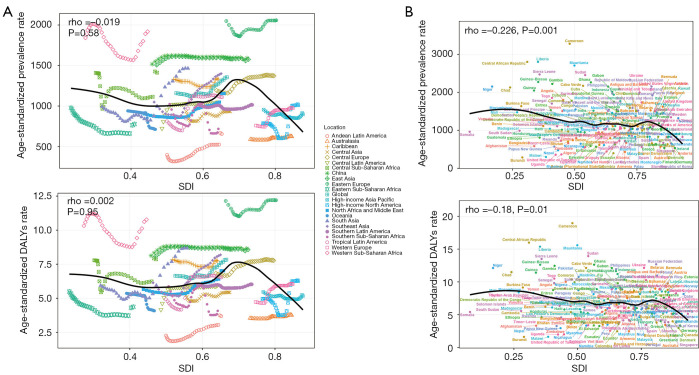
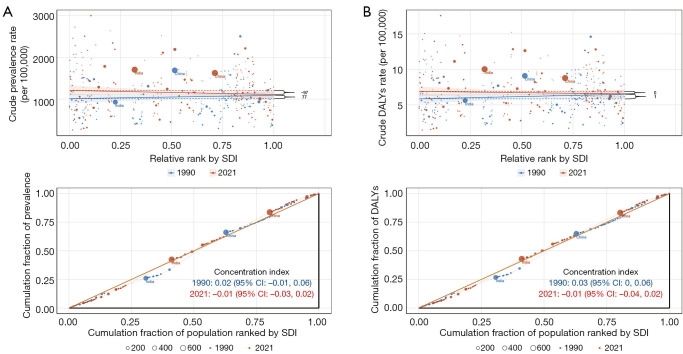
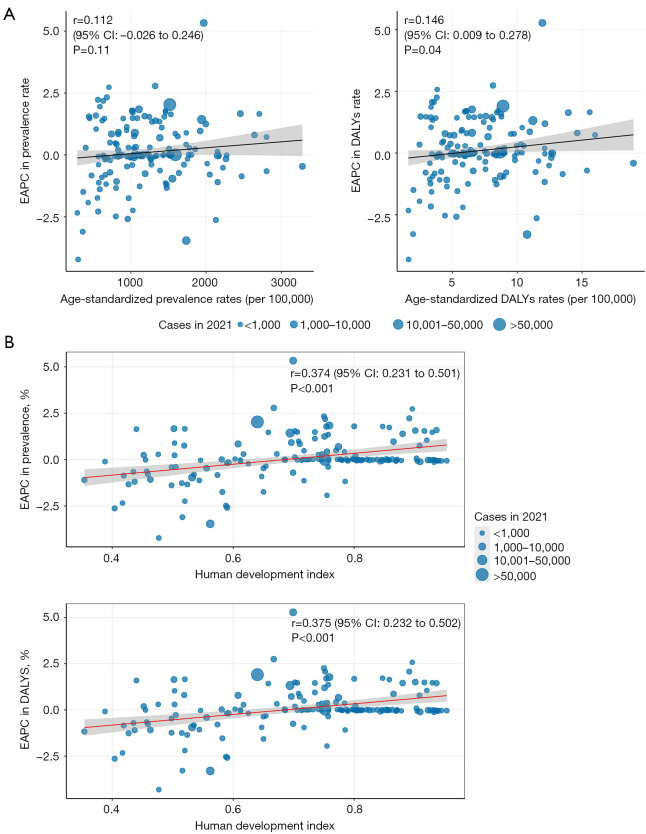
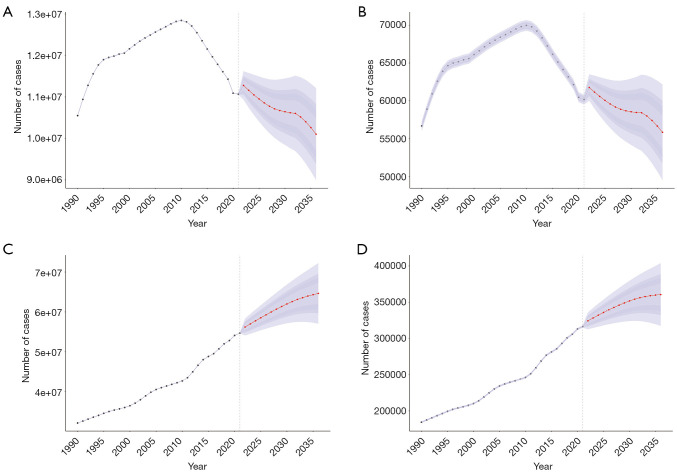
Methods: Using the GBD 2021 dataset, we analyze global male infertility trends from 1990 to 2021 across different subgroups (age, region, and country), focusing on prevalence, disability-adjusted life years (DALYs), and their corresponding age-standardized rates (ASRs), and compare these trends with China. We examine the correlation between the Socio-Demographic Index (SDI) and the burden of male infertility at national and regional levels. Spearman's rank correlation assesses the relationship between ASRs and SDI. Decomposition analysis identifies drivers of the growing male infertility burden globally, in China, and across SDI regions. The slope index of inequality (SII) and the concentration index (CII) quantify global health inequalities, and the Bayesian-Aperiodic-People-Cohort (BAPC) model predicts future trends in male infertility prevalence and DALYs globally and in China.
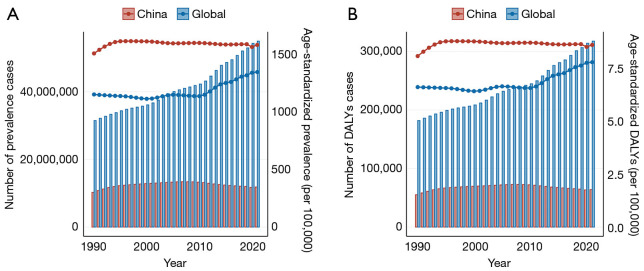
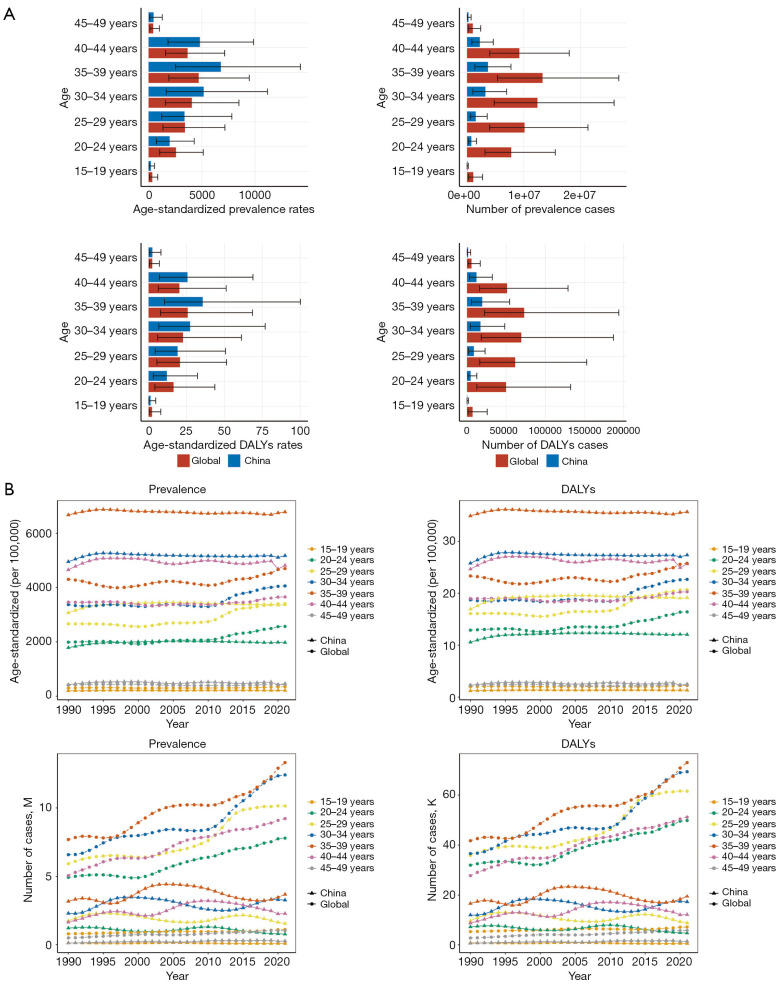
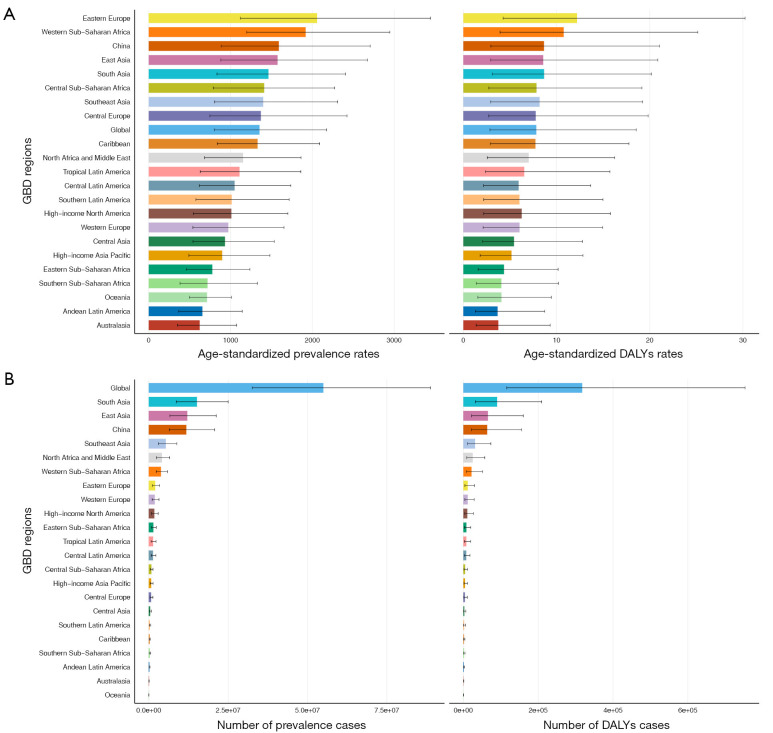
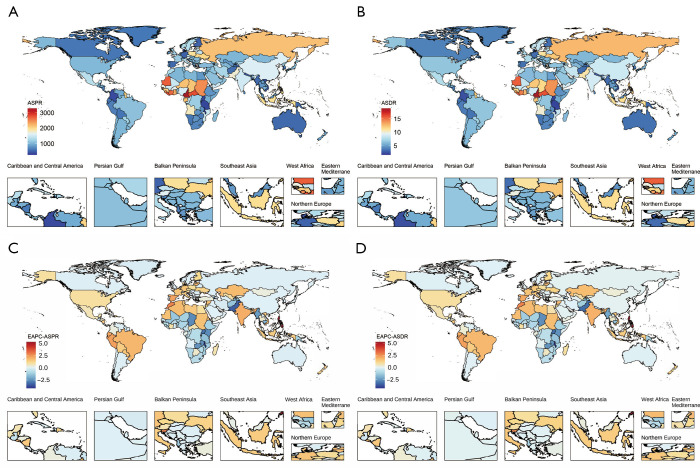
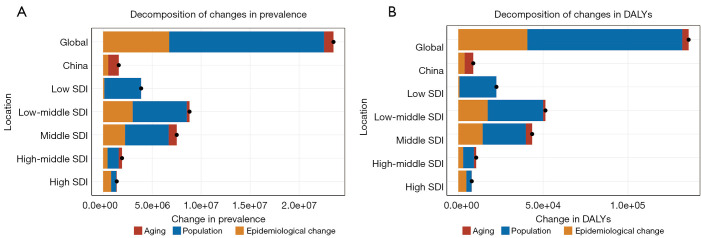
Results: In 2021, the global prevalence of male infertility surpassed 55 million cases, with over 300,000 DALYs. China accounted for approximately 20% of the global burden, with ASRs significantly exceeding the global average. Globally, male infertility prevalence and DALYs increased steadily from 1990 to 2021, particularly in low and low-middle SDI regions, such as South Asia, Southeast Asia, and Latin America. In contrast, China exhibited a stable trend with a gradual decline after 2008. Population growth was identified as the primary driver of global prevalence increases, while age-related factors played a more significant role in China. South and East Asia reported the highest absolute numbers of prevalence cases and DALYs, contributing to half of the global burden. However, the highest ASRs for prevalence and DALYs were recorded in Eastern Europe and Western Sub-Saharan Africa, reaching 1.5 times the global average.
Conclusions: This study underscores the increasing global burden of male infertility, accompanied by pronounced disparities across regions and socioeconomic groups. While the burden in China shows signs of decline, low and low-middle SDI regions continue to face rising prevalence and DALYs. Official attention, along with a comprehensive approach to managing environmental factors, lifestyle changes, and sexually transmitted diseases (STDs), is essential to address these disparities and mitigate the growing global burden of male infertility.
Keywords: Male infertility; age-standardized rates (ASRs); disability-adjusted life years (DALYs); disease burden.
Copyright © 2025 AME Publishing Company. All rights reserved.
Conflict of interest statement
Conflicts of Interest: All authors have completed the ICMJE uniform disclosure form (available at https://tau.amegroups.com/article/view/10.21037/tau-2025-44/coif). The authors have no conflicts of interest to declare.
Figures
Similar articles
-
Global burden trends and future predictions of ischemic heart disease attributable to air pollution in people aged 60 years and older, 1990-2021.Front Public Health. 2025 Jul 4;13:1598092. doi: 10.3389/fpubh.2025.1598092. eCollection 2025. Front Public Health. 2025. PMID: 40687134 Free PMC article.
-
Global pattern, trend and cross-country inequalities of inguinal, femoral, and abdominal hernia among individuals aged 60 and above from 1990 to 2021 and projections until 2040: a population-based study.Surg Endosc. 2025 Jul;39(7):4335-4344. doi: 10.1007/s00464-025-11810-5. Epub 2025 May 28. Surg Endosc. 2025. PMID: 40437076
-
Burden of knee osteoarthritis in China and globally: 1990-2045.BMC Musculoskelet Disord. 2025 Jul 1;26(1):582. doi: 10.1186/s12891-025-08858-8. BMC Musculoskelet Disord. 2025. PMID: 40598022 Free PMC article.
-
Burden of inflammatory bowel disease among elderly, 1990-2019: A systematic analysis based on the global burden of disease study 2019.Autoimmun Rev. 2025 Jan 31;24(2):103708. doi: 10.1016/j.autrev.2024.103708. Epub 2024 Nov 23. Autoimmun Rev. 2025. PMID: 39586389
-
Global, regional, and national burden of shoulder dislocation 1990-2021: a systematic analysis of the Global Burden of Disease study 2021.J Shoulder Elbow Surg. 2025 May 9:S1058-2746(25)00379-9. doi: 10.1016/j.jse.2025.03.037. Online ahead of print. J Shoulder Elbow Surg. 2025. PMID: 40349910 Review.
References
-
- Wright J, Duchesne C, Sabourin S, et al. Psychosocial distress and infertility: men and women respond differently. Fertil Steril 1991;55:100-8. - PubMed
LinkOut - more resources
Full Text Sources