

Evaluation of fatigue progression during overhead tasks and the effects of exoskeleton assistance
- PMID: 40529118
- PMCID: PMC12170952
- DOI: 10.1017/wtc.2025.10008
Evaluation of fatigue progression during overhead tasks and the effects of exoskeleton assistance
Abstract
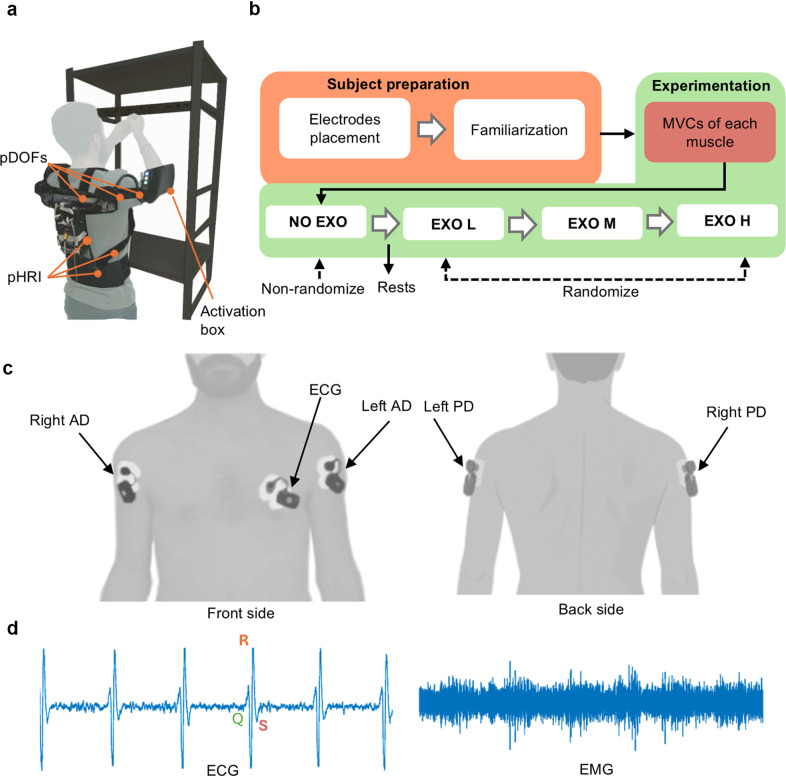
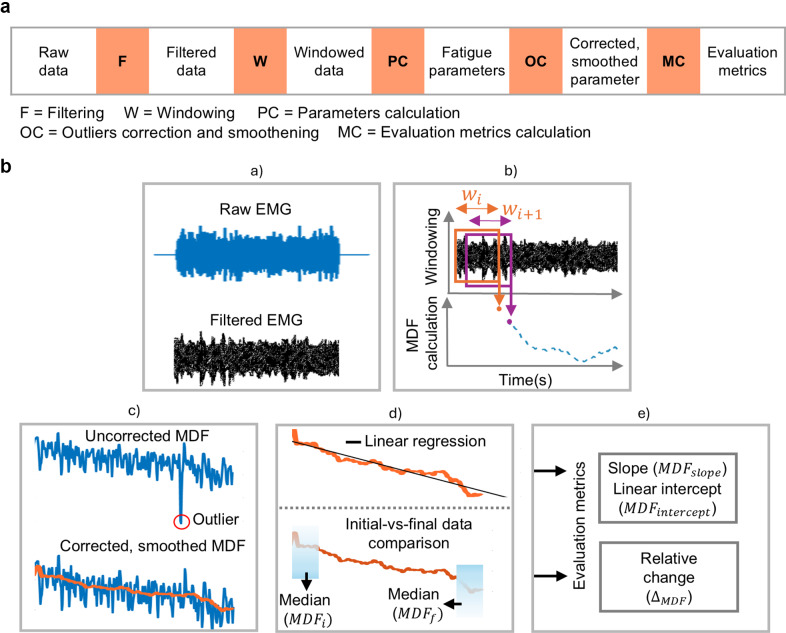
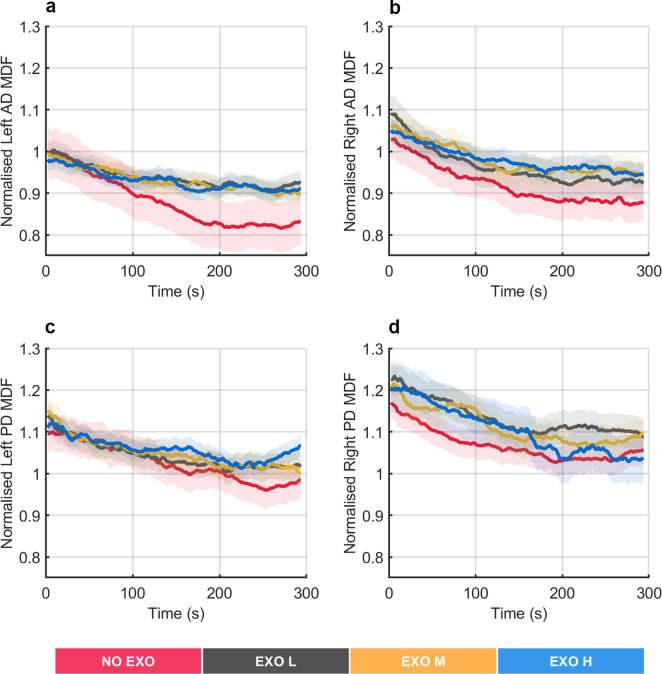
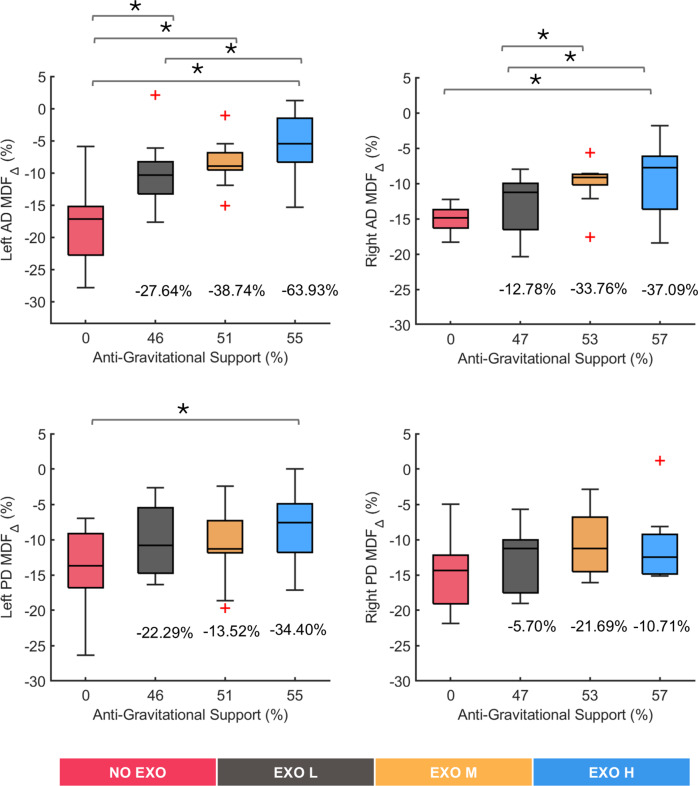
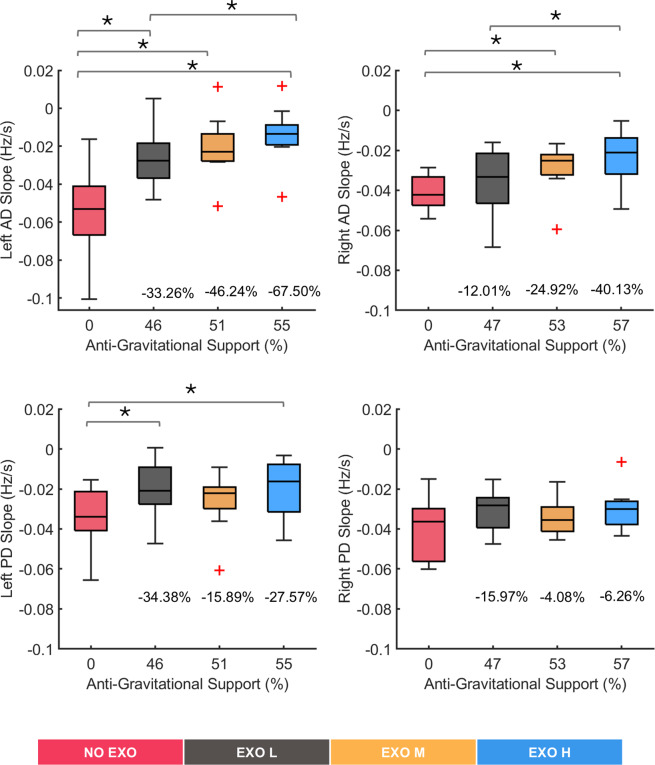
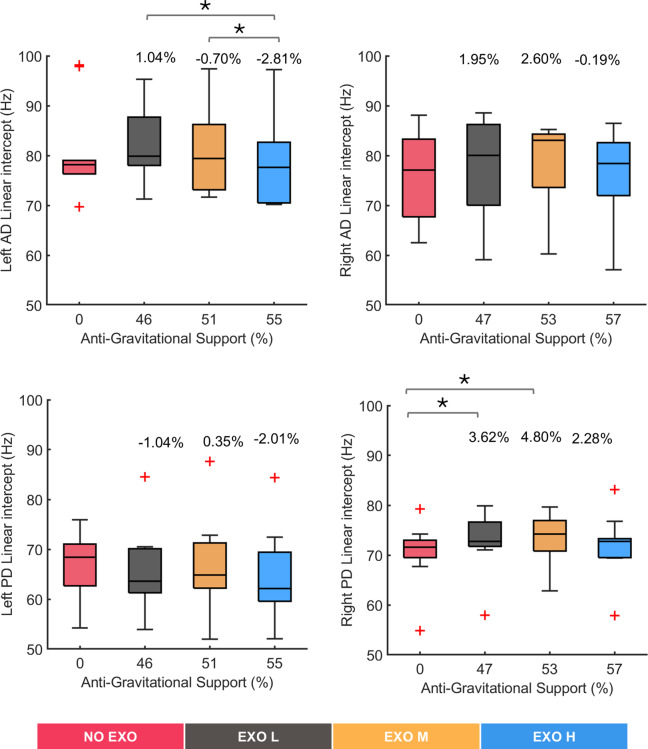
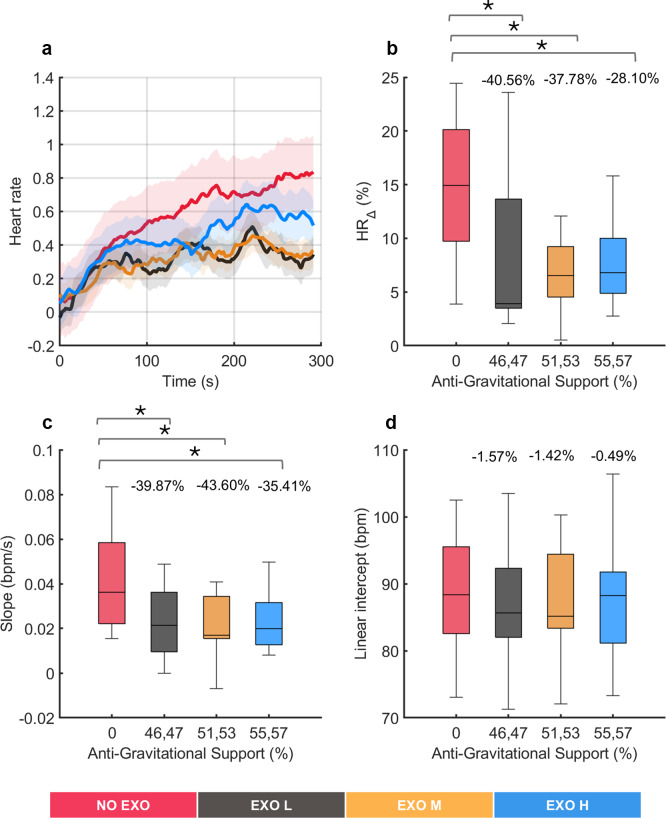
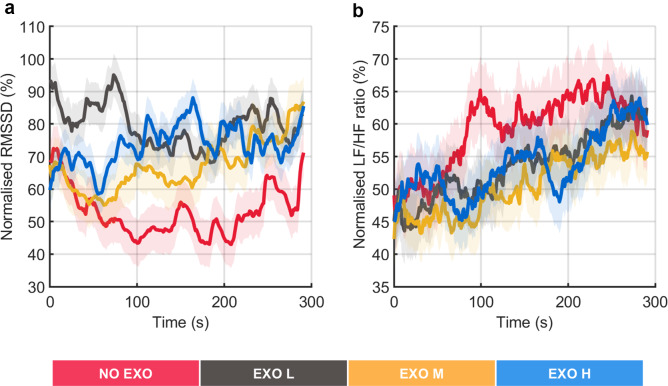
Upper-limb occupational exoskeletons reduce injuries during overhead work. Previous studies focused on muscle activation with and without exoskeletons, but their impact on shoulder fatigue remains unclear. Additionally, no studies have explored how exoskeleton support levels affect fatigue. This study investigates the effects of assistive profiles on muscular and cardiovascular fatigue. Electromyographic (EMG) and electrocardiographic signals were collected to compute EMG median frequency (MDF), heart rate (HR), and heart rate variability (HRV). Fatigue was assessed using three MDF and HR metrics: relative change (,), slope (,), and intercept (,) of the linear regression. Results showed decreased 64% (p = 0.0020) with higher assistance compared to no exoskeleton; decreased 40% (p < 0.0273) with lower assistance, decreased up to 67% (p = 0.0039) and by 43% (p < 0.0098) with higher and medium assistance. HRV metrics included root mean square of successive differences (RMSSD) and low-frequency to high-frequency power ratio (LF/HF). RMSSD indicated parasympathetic dominance, while rising LF/HF ratio suggested physiological strain. Findings support occupational exoskeletons as ergonomic tools for reducing fatigue.
Keywords: biomechanics; exoskeletons; human-robot interaction.
© The Author(s) 2025.
Conflict of interest statement
F.G, N.V, and S.C are shareholders and thus have commercial interests in IUVO S.r.l., a spin-off company of Scuola Superiore Sant’Anna, which designed the technology described in this paper. IUVO S.r.l. is the owner of the IP protecting the H-PULSE technology.
Figures
Similar articles
-
Arm Differences in Muscle Activity Characteristics During a Bilateral Simulated Overhead Work in Right-Handed and Ambidextrous Individuals.IISE Trans Occup Ergon Hum Factors. 2025 Jun 18:1-13. doi: 10.1080/24725838.2025.2517026. Online ahead of print. IISE Trans Occup Ergon Hum Factors. 2025. PMID: 40534240
-
Assessment of Heart Rate Variability Among Plant Nursery Workers.J Agromedicine. 2025 Jun 19:1-10. doi: 10.1080/1059924X.2025.2517845. Online ahead of print. J Agromedicine. 2025. PMID: 40534572
-
Metabolic adaptation and related biomechanics in an ankle-based exoskeleton system during six sessions of steady state walking.Ergonomics. 2025 Jul;68(7):1080-1093. doi: 10.1080/00140139.2024.2394511. Epub 2024 Aug 27. Ergonomics. 2025. PMID: 39192636
-
Prevalence and odds of anxiety and depression in cutaneous malignant melanoma: a proportional meta-analysis and regression.Br J Dermatol. 2024 Jun 20;191(1):24-35. doi: 10.1093/bjd/ljae011. Br J Dermatol. 2024. PMID: 38197404
-
Natural Language Processing Chatbot-Based Interventions for Improvement of Diet, Physical Activity, and Tobacco Smoking Behaviors: Systematic Review.JMIR Mhealth Uhealth. 2025 Jun 11;13:e66403. doi: 10.2196/66403. JMIR Mhealth Uhealth. 2025. PMID: 40503914 Free PMC article.
References
-
- Antwi-Afari MF, Li H, Edwards DJ, Pärn EA, Seo J and Wong AYL (2017) Biomechanical analysis of risk factors for work-related musculoskeletal disorders during repetitive lifting task in construction workers. Automation in Construction 83, 41–47. 10.1016/j.autcon.2017.07.007. - DOI
-
- Bhowmik S, Jelfs B, Arjunan SP and Kumar DK (2017) Outlier removal in facial surface electromyography through Hampel filtering technique. 2017 IEEE Life Sciences Conference (LSC), 258–261. IEEE. 10.1109/LSC.2017.8268192. - DOI
LinkOut - more resources
Full Text Sources
Research Materials
Miscellaneous