

Construction and verification of a risk factor prediction model for neonatal severe pneumonia
- PMID: 40529154
- PMCID: PMC12171221
- DOI: 10.3389/fmed.2025.1536705
Construction and verification of a risk factor prediction model for neonatal severe pneumonia
Abstract
Objective: To construct and validate a risk factor prediction model for neonatal severe pneumonia.
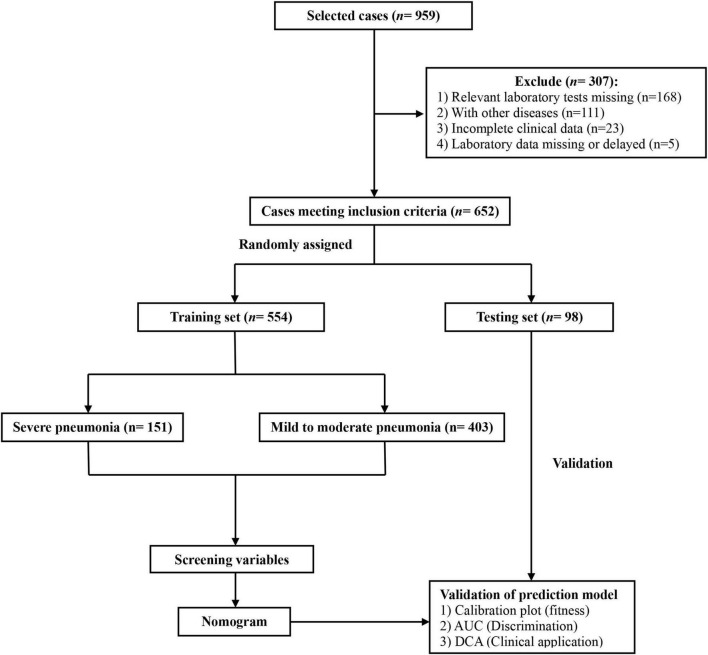
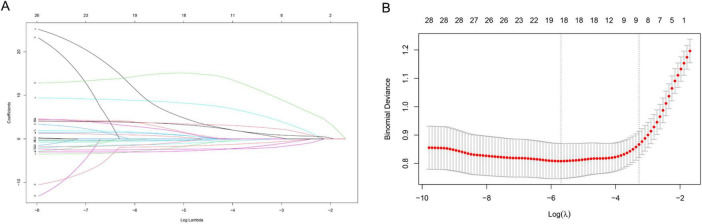
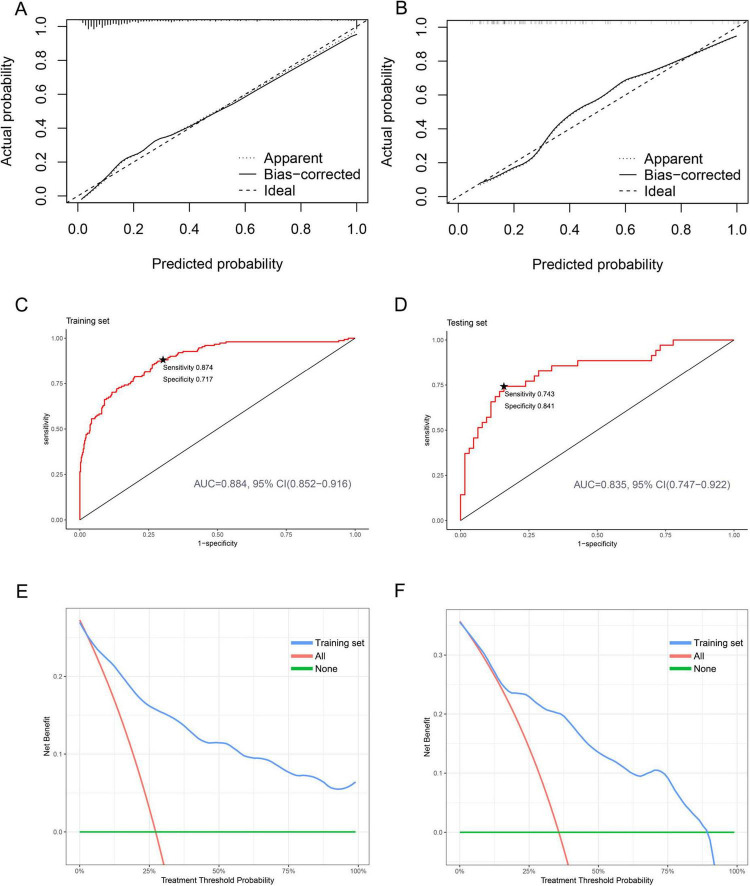
Methods: This study collected data from newborns diagnosed with pneumonia in Children's Hospital Affiliated to Zhengzhou University. A total of 652 newborns were included. Risk factors were identified using Least Absolute Selection and Shrinkage Operator (LASSO) regression and logistic regression analysis. The nomogram was used to construct a prediction model. The effectiveness of the model was evaluated using calibration curve, receiver operating characteristic (ROC) curve, and decision curve analysis (DCA).
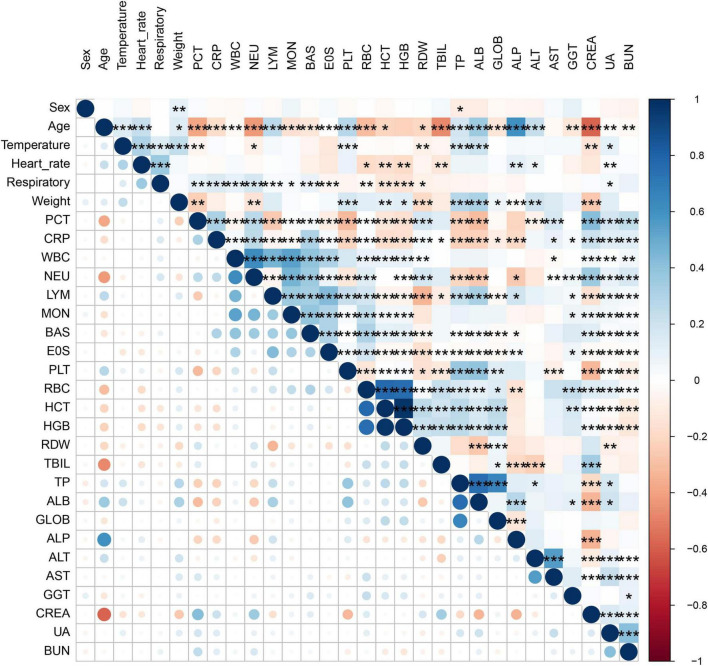
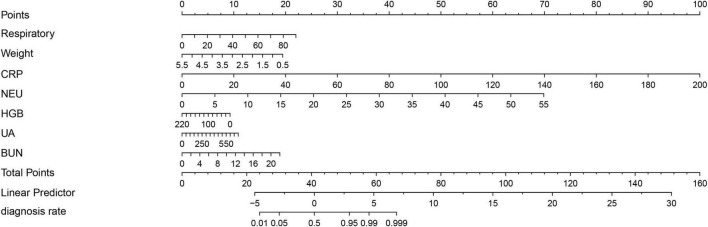
Results: Out of 652 newborns, 186 (29%) were diagnosed with severe pneumonia. The patients were randomly divided into a training set (n = 554) and a testing set (n = 98) in a ratio of 85:15. A total of 30 indicators were analyzed. Respiratory rate (OR = 1.058, 95% CI: 1.035-1.081), weight (OR = 0.483, 95% CI: 0.340-0.686), C-reactive protein (CRP) (OR = 1.142, 95% CI: 1.028-1.268), neutrophil (NEU) (OR = 1.384, 95% CI: 1.232-1.555), hemoglobin (HGB) (OR = 0.989, 95% CI: 0.979-0.999), uric acid (UA) (OR = 1.006, 95% CI: 1.002-1.010), and blood urea nitrogen (BUN) (OR = 1.230, 95% CI: 1.058-1.431) were identified as independent risk factors for neonatal severe pneumonia. The calibration curve showed significant agreement. The area under the ROC curve (AUC) was 0.884 (95% CI: 0.852-0.916) for the training set, and 0.835 (95% CI: 0.747-0.922) for the testing set. DCA demonstrated good predictive properties.
Conclusion: The prediction model based on respiratory rate, weight, CRP, NEU, HGB, UA, and BUN has shown promising predictive value in distinguishing between mild to moderate pneumonia and severe pneumonia in neonates.
Keywords: neonatal; nomogram; predictive model; risk factor; severe pneumonia.
Copyright © 2025 Gong, Gao, Ni, Shi, Shan, Sun, Wang, Xu and Yang.
Conflict of interest statement
The authors declare that the research was conducted in the absence of any commercial or financial relationships that could be construed as a potential conflict of interest.
Figures
Similar articles
-
[Construction of a predictive model for hospital-acquired pneumonia risk in patients with mild traumatic brain injury based on LASSO-Logistic regression analysis].Zhonghua Wei Zhong Bing Ji Jiu Yi Xue. 2025 Apr;37(4):374-380. doi: 10.3760/cma.j.cn121430-20240823-00715. Zhonghua Wei Zhong Bing Ji Jiu Yi Xue. 2025. PMID: 40814711 Chinese.
-
Establishment and validation of a predictive model for Lobar pneumonia caused by Mycoplasma pneumoniae infection in children.Sci Rep. 2025 Jul 2;15(1):22811. doi: 10.1038/s41598-025-05548-2. Sci Rep. 2025. PMID: 40594457 Free PMC article.
-
Predictive value of hemoglobin, serum PAF, and IL-17 in patients with radiation enteritis complicated with intestinal obstruction and construction and validation of predictive model.Front Med (Lausanne). 2025 Aug 1;12:1599668. doi: 10.3389/fmed.2025.1599668. eCollection 2025. Front Med (Lausanne). 2025. PMID: 40823570 Free PMC article.
-
Prenatal administration of progestogens for preventing spontaneous preterm birth in women with a multiple pregnancy.Cochrane Database Syst Rev. 2019 Nov 20;2019(11):CD012024. doi: 10.1002/14651858.CD012024.pub3. Cochrane Database Syst Rev. 2019. PMID: 31745984 Free PMC article.
-
Prevalence and odds of anxiety and depression in cutaneous malignant melanoma: a proportional meta-analysis and regression.Br J Dermatol. 2024 Jun 20;191(1):24-35. doi: 10.1093/bjd/ljae011. Br J Dermatol. 2024. PMID: 38197404
References
-
- GBD 2015 Mortality and Causes of Death Collaborators. Global, regional, and national life expectancy, all-cause mortality, and cause-specific mortality for 249 causes of death, 1980-2015: A systematic analysis for the Global Burden of Disease Study 2015. Lancet. (2016) 388:1459–544. 10.1016/s0140-6736(16)31012-1 - DOI - PMC - PubMed
-
- World Health Organization [WHO]. Revised WHO Classification and Treatment of Pneumonia in Children at Health Facilities: Evidence Summaries. Geneva: World Health Organization; (2014). - PubMed
-
- Ghadimi M, Siemieniuk R, Guyatt G, Loeb M, Hazzan A, Aminaei D, et al. Empiric antibiotic regimens in adults with non-ventilator-associated hospital-acquired pneumonia: A systematic review and network meta-analysis of randomized controlled trials. Clin Microbiol Infect. (2024) 30:1351–63. 10.1016/j.cmi.2024.05.017 - DOI - PubMed
LinkOut - more resources
Full Text Sources
Research Materials
Miscellaneous