

High-resolution accurate mass- mass spectrometry based- untargeted metabolomics: Reproducibility and detection power across data-dependent acquisition, data-independent acquisition, and AcquireX
- PMID: 40529182
- PMCID: PMC12173630
- DOI: 10.1016/j.csbj.2025.05.046
High-resolution accurate mass- mass spectrometry based- untargeted metabolomics: Reproducibility and detection power across data-dependent acquisition, data-independent acquisition, and AcquireX
Abstract
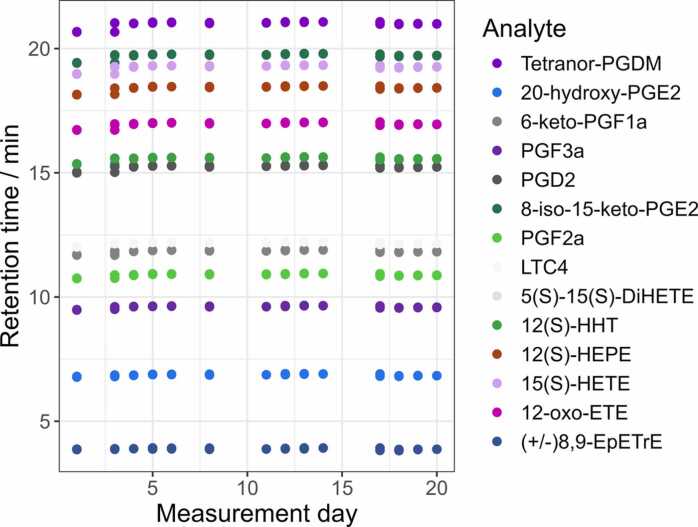
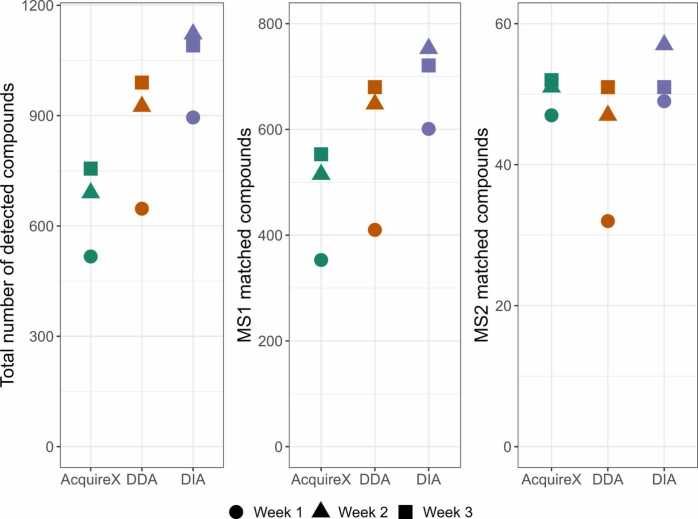
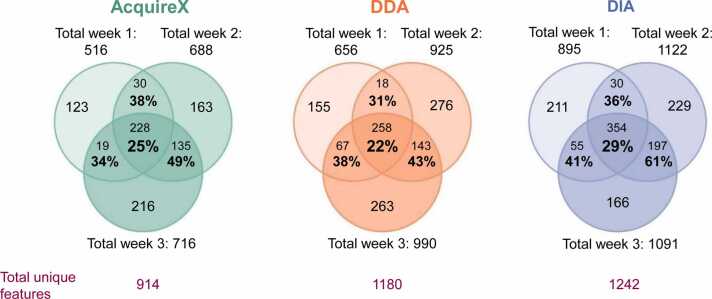
Untargeted metabolomics aims at the unbiased metabolic profiling and biomarker discovery but requires methods with high sensitivity and reproducibility. Here, we compare three acquisition modes-Data-Dependent Acquisition (DDA), Data-Independent Acquisition (DIA), and AcquireX -to evaluate performance and reproducibility in detecting low-abundance metabolites in a complex matrix. A system suitability test (SST) based on 14 eicosanoid standards was implemented to evaluate the suitability of our instrumental setup prior to conducting untargeted metabolomics analyses and monitor long-term system performance. Bovine liver total Lipid Extract (TLE) was spiked with decreasing levels (10-0.01 ng/mL) of the eicosanoid standard mix (StdMix) to compare the detection power of each mode. Reproducibility was evaluated over three independent measurements, spaced one week apart. Chromatographic separation was performed on a C18-Kinetex Core-Shell column and HRAM-MS/MS data were acquired using an Orbitrap Exploris 480. DIA detected and identified the highest number of metabolic features, (averaging 1036 metabolic features over three measurements), followed by DDA (18 % fewer) and AcquireX (37 % fewer). Moreover, DIA demonstrated superior reproducibility, with a coefficient of variance of 10 % across detected compounds over three measurements, compared to 17 % for DDA and 15 % for AcquireX. DIA further exhibited better compound identification consistency, with 61 % overlap between two days, compared to DDA (43 %) and AcquireX (50 %). DIA reproduced fragmentation spectra patterns with high consistency, contributing to higher reproducibility in compound identification. DIA showed the best detection power for all spiking eicosanoids at 10 and 1 ng/mL in TLE matrix. At low spiking levels, 0.1 and 0.01 ng/mL, a general cut-off was observed for the three acquisition modes. None of this assessed acquisition modes was able to detect and/or identify eicosanoids at physiologically relevant concentrations, explaining their frequent omission in routine untargeted analyses.
Keywords: AcquireX; DDA; DIA; detection power; reproducibility.
© 2025 The Authors. Published by Elsevier B.V. on behalf of Research Network of Computational and Structural Biotechnology.
Conflict of interest statement
The authors declare that they have no known competing financial interests or personal relationships that could have appeared to influence the work reported in this paper.
Figures


Similar articles
-
Data-Independent Acquisition Mass Spectrometry as a Tool for Metaproteomics: Interlaboratory Comparison Using a Model Microbiome.Proteomics. 2025 May;25(9-10):e202400187. doi: 10.1002/pmic.202400187. Epub 2025 Apr 10. Proteomics. 2025. PMID: 40211604
-
Multilaboratory Untargeted Mass Spectrometry Metabolomics Collaboration to Identify Bottlenecks and Comprehensively Annotate A Single Dataset.Anal Chem. 2025 Aug 5;97(30):16110-16122. doi: 10.1021/acs.analchem.4c05577. Epub 2025 Jul 22. Anal Chem. 2025. PMID: 40693864 Free PMC article.
-
LC-MS Orbitrap-based metabolomics using a novel hybrid zwitterionic hydrophilic interaction liquid chromatography and rigorous metabolite identification reveals doxorubicin-induced metabolic perturbations in breast cancer cells.RSC Adv. 2025 Jun 19;15(26):20745-20759. doi: 10.1039/d5ra01044f. eCollection 2025 Jun 16. RSC Adv. 2025. PMID: 40538746 Free PMC article.
-
Prenatal administration of progestogens for preventing spontaneous preterm birth in women with a multiple pregnancy.Cochrane Database Syst Rev. 2019 Nov 20;2019(11):CD012024. doi: 10.1002/14651858.CD012024.pub3. Cochrane Database Syst Rev. 2019. PMID: 31745984 Free PMC article.
-
Global Delphi consensus on treatment goals for generalized pustular psoriasis.Br J Dermatol. 2025 Mar 18;192(4):706-716. doi: 10.1093/bjd/ljae491. Br J Dermatol. 2025. PMID: 39844356
References
-
- Wang X., Chen S., Jia W. Metabolomics in cancer biomarker research. Curr Pharm Rep. 2016;2:293–298. doi: 10.1007/s40495-016-0074-x. - DOI
LinkOut - more resources
Full Text Sources