. 2025 Jun 2:19:1561291.
doi: 10.3389/fnins.2025.1561291. eCollection 2025.

Preliminary study on the time-correlation changes in brain neurotransmitters of mice exposed to mushroom toxin ibotenic acid

Affiliations

Preliminary study on the time-correlation changes in brain neurotransmitters of mice exposed to mushroom toxin ibotenic acid

Ruanxian Dai et al. Front Neurosci. .

Abstract

Background: Mushroom poisoning represents a significant food safety issue globally, particularly neurotoxic mushroom poisoning, which raises considerable concern due to its potential to induce central nervous system symptoms. Ibotenic acid is identified as the primary neurotoxin associated with this form of poisoning; however, the underlying mechanisms of its neurotoxicity remain poorly understood.

Objective: This study aims to systematically evaluate the effects of ibotenic acid exposure across three consecutive key time points, from intoxication to recovery, on neurotransmitters related to the GABA/Glutamic-Acid, dopaminergic, serotonergic, and cholinergic systems in five brain regions: the cerebral cortex, hippocampus, striatum, brain stem, and cerebellum.

Methods: Through behavioral tests, we assessed the effects of ibotenic acid exposure on voluntary activities and learning and memory functions in mice. Additionally, we analyzed the changes in neurotransmitter concentrations across different brain regions using targeted metabolomics.

Results: Behavioral results indicated that the total movement distance and speed in the open field test were significantly reduced, while the resting time was prolonged in the ibotenic acid-exposed group (P < 0.0001). The results of targeted metabolomics demonstrated that, compared to the control group, levels of glutamic acid in the hippocampus and brain stem significantly decreased after 4 h of ibotenic acid exposure (P < 0.05, P < 0.001). Additionally, epinephrine levels in the cerebral cortex decreased at 20 min (P < 0.05), while tyrosine levels in the brain stem and cerebellum decreased after 4 h (P < 0.05). In the brain stem region, the tryptophan levels in each exposure group decreased significantly compared with the 4-h exposure group (P < 0.01), and brain stem choline levels significantly decreased (P < 0.05). Conversely, homovanillic acid levels in the brain stem increased (P < 0.01).

Conclusion: Preliminary studies have demonstrated that acute exposure to ibotenic acid inhibits motor activity but does not significantly affect learning and memory in mice. Exposure to ibotenic acid induces alterations in GABA/Glutamic-Acid, dopaminergic, serotonergic, and neurotransmitters associated with the cholinergic system in the brains of mice, with the most pronounced changes occurring in the brain stem region, exhibiting time-dependent and region-specific effects. This study offers new insights into the neurotoxic mechanisms of ibotenic acid.

Keywords: ibotenic acid; metabolomics; neurotoxic mushroom poisoning; neurotransmitters; toxin.


Conflict of interest statement

The authors declare that they have no known competing financial interests or personal relationships that could have appeared to influence the work reported in this paper.

Figures

FIGURE 1
FIGURE 1
A graphic illustration of the experimental design (created with BioRender.com).
FIGURE 2
FIGURE 2
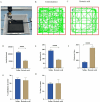
(A–C) Trajectory map of the open field test in mice. (D,E) Exposure to ibotenic acid significantly decreased both the total ambulation and speed of the mice (P < 0.0001), (F) quiescent time increase (P < 0.0001). (G,H) ibotenic acid exposure did not significantly affect the percentage of ambulation in the center and time in the central area (P > 0.05). Data are expressed as mean ± SEM. Statistical analysis was done by unpaired t-test (****P < 0.0001). P < 0.05 was considered a significant difference across groups.
FIGURE 3
FIGURE 3
(A–C) Schematic illustration of the 2-trial Y-maze tests. (D–I) Exposure to ibotenic acid did not significantly impact the percentage of ambulation, the percentage of number, and the percentage of time in the mice’s novel arm and other arm compared to saline controls. Data are expressed as mean ± SEM. Statistical analysis was done by unpaired t-test. P < 0.05 was considered significant differences across groups.
FIGURE 4
FIGURE 4
Sample QC analysis. (A) Total ion flow chart (TIC) overlap. (B) QC sample correlation analysis.
FIGURE 5
FIGURE 5
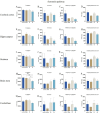
Effects of ibotenic acid exposure on GABA/glutamic-acid pathway-related neurotransmitters in different brain regions of mice in different time groups. (A–C,G–I,M–O) No statistically significant differences were observed in the changes of GABA/ Glutamic-Acid pathway-related metabolite concentrations across the cerebral cortex, striatum, and cerebellum regions. (D,F,J,L) The concentration changes of GABA and glutamine in the hippocampus region and brain stem regions did not reach statistically significant levels. (E) 4-h after exposure to ibotenic acid, the concentration of glutamic-acid in the hippocampus was significantly reduced compared to the control and 20-min exposure groups (p < 0.05). (K) The concentration of glutamic-acid in the brain stem was decreased in comparison to the control, 20-min exposure, and 1-h exposure groups (p < 0.001, p < 0.05, and p < 0.01, respectively). Concentrations were normalized. Data are expressed as mean ± SEM. Statistical analysis was carried out by one-way analysis of variance (ANOVA) followed by Tukey’s post-hoc test for multiple comparisons (*P < 0.05, **P < 0.01, ***P < 0.001).
FIGURE 6
FIGURE 6
Effects of ibotenic acid exposure on Dopaminergic pathway-related neurotransmitters in different brain regions of mice in different time groups. (A,C,D) The concentration changes of 3-hydroxytyramine, tyrosine, and homovanillic acid did not reach statistically significant levels in the cerebral cortex. (B) At 20 min post-exposure, the concentration of epinephrine in the cerebral cortex was significantly reduced compared to the control group (p < 0.05). (E–L) In the hippocampus and striatum regions, no statistically significant differences were observed in the changes in metabolite concentrations associated with the dopaminergic pathway. (M,N) The concentrations of 3-hydroxytyramine and epinephrine in the brain stem region were not statistically significant. (O) At 4 hours post-exposure, tyrosine concentrations were decreased in the brain stem region relative to both the control and 20-minute exposure groups (p < 0.05), (P) At 4 hours post-exposure, the concentration of homovanillic acid in the brain stem region was significantly elevated (p < 0.01, p < 0.01, and p < 0.05) compared to the control, 20-minute exposure and 1-hour exposure groups, respectively. (Q,R,T) The concentrations of 3-hydroxytyramine, epinephrine, and homovanillic acid did not show statistically significant changes in the cerebellum region. (S) At 4 hours after exposure, tyrosine concentrations in the cerebellum region showed a significant decrease (p < 0.05) when compared to the 20-minute exposure group. Concentrations were normalized. Data are expressed as mean ± SEM. Statistical analysis was carried out by one-way analysis of variance (ANOVA) followed by Tukey’s post-hoc test for multiple comparisons (*P < 0.05, **P < 0.01).
FIGURE 7
FIGURE 7
Effects of ibotenic acid exposure on Serotonin pathway-related neurotransmitters in different brain regions of mice in different time groups. (A–L,Q–T) There were no significant differences in the concentrations of metabolites associated with the serotonin signaling pathway across the cerebral cortex, hippocampus, striatum, and cerebellum regions. (M) The observation was a decrease in tryptophan concentration in the brain stem region at 4 hours post-exposure compared to the control, 20-minute exposure, and 1-hour exposure groups (p < 0.01, p < 0.01, and p < 0.05, respectively). (N,O,P) The concentration changes of serotonin, 5-hydroxyindoleacetic acid, and 5-hydroxytryptophan did not achieve statistically significant levels in the brain stem region. Concentrations were normalized. Data are expressed as mean ± SEM. Statistical analysis was carried out by one-way analysis of variance (ANOVA) followed by Tukey’s post-hoc test for multiple comparisons. P < 0.05 was considered significant differences across groups (*P < 0.05, **P < 0.01).
FIGURE 8
FIGURE 8
Effects of ibotenic acid exposure on Cholinergic pathway-related neurotransmitters in different brain regions of mice in different time groups. (A–F,I,J) No significant differences were observed in the concentrations of metabolites associated with cholinergic signaling pathways across the cerebral cortex, hippocampus, striatum, and cerebellum regions. (H) Choline concentrations in the brain stem region was significantly reduced (p < 0.05) compared to controls at 4 hours post-exposure. (G) The concentration changes of acetylcholine did not reach statistically significant levels in the brain stem region. Concentrations were normalized. Data are expressed as mean ± SEM. Statistical analysis was carried out by one-way analysis of variance (ANOVA) followed by Tukey’s post-hoc test for multiple comparisons. P < 0.05 was considered significant differences across groups (*P < 0.05).
FIGURE 9
FIGURE 9
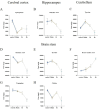
Ibotenic acid exposure at different times showed significant changes in neurotransmitter in different brain regions. (A–E,G,H) The concentrations of epinephrine, glutamic-acid, tyrosine, tryptophan, and choline generally displayed a downward trend. (F) The concentration of homovanillic acid exhibited a significant upward trend. Data are expressed as mean ± SEM.
FIGURE 10
FIGURE 10
The effect of ibotenic acid on the concentration of neurotransmitters in various brain regions. The blue arrow represent decreased concentrations of neurotransmitters. The red arrow represent increased concentrations of neurotransmitters (created with BioRender.com).

Similar articles

References

    1. Alseekh S., Aharoni A., Brotman Y., Contrepois K., D’Auria J., Ewald J., et al. (2021). Mass spectrometry-based metabolomics: A guide for annotation, quantification and best reporting practices. Nat. Methods 18 747–756. 10.1038/s41592-021-01197-1 - DOI - PMC - PubMed
    1. Baron A., Rushton S., Rens N., Morris C., Blain P., Judge S. (2013). Sex differences in effects of low level domoic acid exposure. Neurotoxicology 34 1–8. 10.1016/j.neuro.2012.10.010 - DOI - PubMed
    1. Cardoso M., Rocha A., Souza-Júnior J., Menezes-Filho J. (2023). Analytical method for urinary homovanillic acid and 5-hydroxyindoleacetic acid levels using HPLC with electrochemical detection applied to evaluate children environmentally exposed to manganese. Biomed. Chromatogr. 37:e5699. 10.1002/bmc.5699 - DOI - PubMed
    1. Cheng H., Zhao J., Zhang J., Wang Z., Liu Z., Ma X., et al. (2023). Attribution analysis of household foodborne disease outbreaks in China, 2010-2020. Foodborne Pathog. Dis. 20 358–367. 10.1089/fpd.2022.0070 - DOI - PubMed
    1. Cheng Y., Lin C., Lane H. (2021). Involvement of cholinergic, adrenergic, and glutamatergic network modulation with cognitive dysfunction in Alzheimer’s Disease. Int. J. Mol. Sci. 22:2283. 10.3390/ijms22052283 - DOI - PMC - PubMed

LinkOut - more resources