. 2025 Jun 12:18:3117-3128.
doi: 10.2147/IJGM.S524450. eCollection 2025.

Predicting Stroke-Associated Pneumonia in Acute Ischemic Stroke: A Machine Learning Model Development and Validation Study with CBC-Derived Inflammatory Indices

Affiliations

Predicting Stroke-Associated Pneumonia in Acute Ischemic Stroke: A Machine Learning Model Development and Validation Study with CBC-Derived Inflammatory Indices

Mengqi Xie et al. Int J Gen Med. .

Abstract

Purpose: Stroke-associated pneumonia (SAP), a critical complication of ischemic stroke, significantly worsens outcomes. Our aim was to identify SAP risk factors and develop a machine learning (ML) model for early risk stratification.

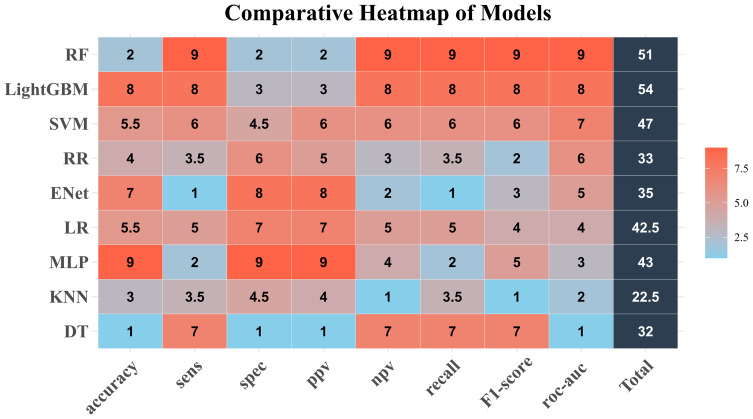
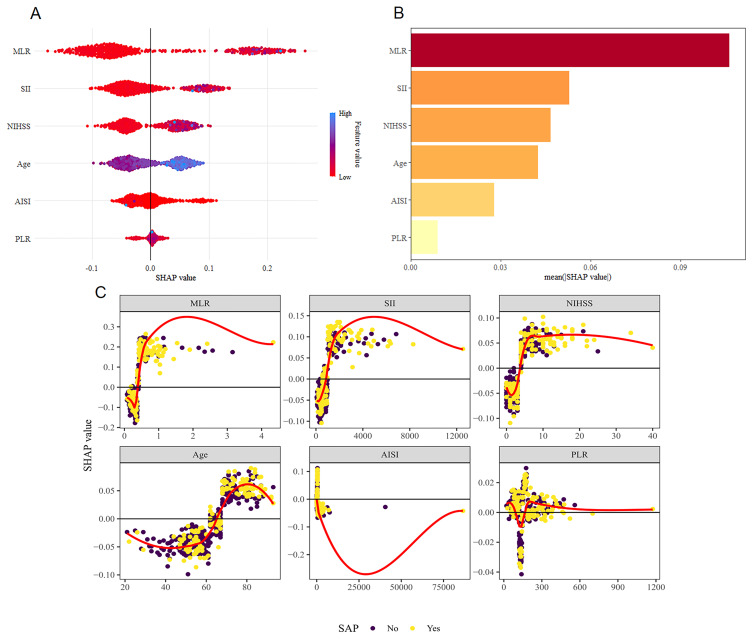
Methods: This retrospective study analyzed 574 ischemic stroke patients, divided into training (75%) and testing (25%) sets. Nine ML models were trained using 10-fold cross-validation, with performance evaluated by accuracy, AUC-ROC, and F1-score. Key predictors were interpreted via SHAP analysis. An interactive web tool was developed using the optimal model.

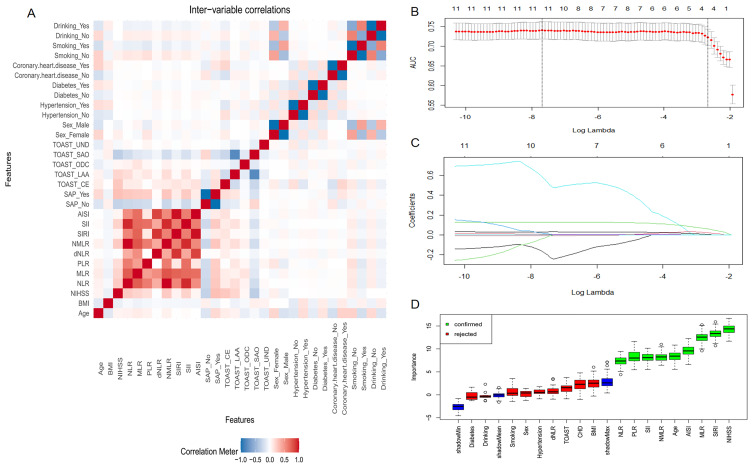
Results: SAP incidence was 32.4%. LightGBM demonstrated superior predictive performance (ranking score=54) without overfitting, identifying Monocyte-to-lymphocyte ratio (MLR), systemic immune-inflammation index (SII), NIHSS score, age, aggregate index of systemic inflammation (AISI), and platelet-to-lymphocyte ratio (PLR) as the top predictors.

Conclusion: Our findings demonstrate that machine learning models exhibit strong predictive performance for SAP, with the LightGBM algorithm outperforming other approaches. The web-based prediction tool developed from this model provides clinicians with actionable insights to support real-time clinical decision-making.

Keywords: ischemic stroke; machine learning; stroke-associated pneumonia.


Conflict of interest statement

The authors report no conflicts of interest in this work.

Figures

Figure 1
Figure 1
This figure outlines variable selection methodology: (A) Heat map visualizing variable correlations through a color gradient. Red hues indicate positive correlations, blue hues represent negative correlations, with color intensity scaled to correlation magnitude (darker shades denote stronger associations). The x-axis and y-axis display clinical variables: Age, BMI, NIHSS (National Institutes of Health Stroke Scale), NLR (neutrophil-to-lymphocyte ratio), MLR (monocyte-to-lymphocyte ratio), PLR (platelet-to-lymphocyte ratio), dNLR (derived NLR), NMLR (neutrophil-monocyte-to-lymphocyte ratio), SIRI (systemic inflammation response index), SII (systemic immune-inflammation index), AISI (aggregate index of systemic inflammation), SAP (Stroke-associated pneumonia), TOAST (Trial of Org 10172 in Acute Stroke Treatment classification), Sex, Hypertension, Diabetes, Coronary heart disease, Smoking, Drinking. (B) Optimization of regularization parameter (lambda, λ) through cross-validation Area Under the Curve (AUC) analysis. The x-axis represents the logarithmically transformed regularization parameter [log (λ)], while the y-axis indicates the AUC values. The peak AUC value (marked by red vertical line) identifies the optimal λ that balances model complexity and predictive performance. (C) Regularization path tracking coefficient evolution across λ values (y-axis: coefficients); features with coefficients reaching zero are eliminated. (D) Feature selection by the Boruta algorithm identifying significant clinical variables (green: confirmed predictors; red: rejected non-contributors). The x-axis displays clinical variables: Age, BMI, NIHSS (National Institutes of Health Stroke Scale), NLR (neutrophil-to-lymphocyte ratio), MLR (monocyte-to-lymphocyte ratio), PLR (platelet-to-lymphocyte ratio), dNLR (derived NLR), NMLR (neutrophil-monocyte-to-lymphocyte ratio), SIRI (systemic inflammation response index), SII (systemic immune-inflammation index), AISI (aggregate index of systemic inflammation), SAP (Stroke-associated pneumonia), TOAST (Trial of Org 10172 in Acute Stroke Treatment classification), Sex, Hypertension, Diabetes, Coronary heart disease, Smoking, Drinking.
Figure 2
Figure 2
Comparative Heatmap of Models. The rows represent different models: [Random Forest (RF), Light Gradient Boosting Machine (LightGBM), Support Vector Machine (SVM), Ridge Regression (RR), k-Nearest Neighbors (KNN), Elastic Net (ENet), Multilayer Perceptron (MLP), Logistic Regression (LR), and Decision Tree (DT)]. The columns represent different performance metrics: accuracy, sensitivity, specificity, positive/negative predictive values (PPV/NPV), recall, F1-score, and area under the ROC curve (roc-auc). Each cell in the heatmap is color-coded to indicate the performance score, with darker colors representing higher values. The numbers in the cells represent the specific scores for each model-metric combination. The bottom row provides the total scores for each model across all metrics, and the rightmost column provides the average scores for each metric across all models. This heatmap allows for a quick visual assessment of the relative performance of different models across various evaluation criteria.
Figure 3
Figure 3
This figure provides a comprehensive analysis of feature importance and their impact on the model output using SHAP values. MLR stands for Monocyte-to-lymphocyte ratio, SII stands for Systemic immune-inflammation index, AISI stands for Aggregate index of systemic inflammation, PLR stands for Platelet-to-lymphocyte ratio. (A) It shows the distribution of SHAP values for each feature. (B) It displays the mean absolute SHAP values indicating feature importance.(C) It illustrates the relationship between feature values and their corresponding SHAP values, differentiated by the presence or absence of SAP.

Similar articles

References

    1. Wang YJ, Li ZX, Gu HQ, et al. China stroke statistics: an update on the 2019 report from the national center for healthcare quality management in neurological diseases, China national clinical research center for neurological diseases, the Chinese stroke association, national center for chronic and non-communicable disease control and prevention, Chinese center for disease control and prevention and institute for global neuroscience and stroke collaborations. Stroke Vasc Neurol. 2022;7(5):415–450. doi: 10.1136/svn-2021-001374 - DOI - PMC - PubMed
    1. Westendorp WF, Nederkoorn PJ, Vermeij JD, et al. Post-stroke infection: a systematic review and meta-analysis. BMC Neurol. 2011;11(1):110. doi: 10.1186/1471-2377-11-110 - DOI - PMC - PubMed
    1. Bustamante A, Giralt D, García-Berrocoso T, et al. The impact of post-stroke complications on in-hospital mortality depends on stroke severity. Eur Stroke J. 2017;2(1):54–63. doi: 10.1177/2396987316681872 - DOI - PMC - PubMed
    1. Teh WH, Smith CJ, Barlas RS, et al. Impact of stroke-associated pneumonia on mortality, length of hospitalization, and functional outcome. Acta Neurol Scand. 2018;138(4):293–300. doi: 10.1111/ane.12956 - DOI - PubMed
    1. Meisel A. Preventive antibiotic therapy in stroke: passed away?. Lancet. 2015;385(9977):1486–1487. doi: 10.1016/S0140-6736(15)60076-9 - DOI - PubMed

LinkOut - more resources