Mitigating gaseous nitrogen emissions in cotton fields through green manure and reduced nitrogen fertilization
- PMID: 40529573
- PMCID: PMC12171444
- DOI: 10.3389/fmicb.2025.1615142
Mitigating gaseous nitrogen emissions in cotton fields through green manure and reduced nitrogen fertilization
Abstract
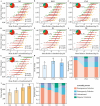
Integrating green manure with reduced nitrogen (N) fertilization is a promising strategy to mitigate N emissions in intensive cotton cultivation, however, the underlying mechanisms remain poorly understood. This study investigated the effects of three green manure incorporation patterns-no green manure (NG), Orychophragmus violaceus (OVG), and Vicia villosa (VVG)-combined with four N reduction levels (100, 50, 25%, and conventional) on gaseous N emissions (NH3 and N2O), soil physicochemical properties, and bacterial community characteristics using a cotton field experiment in the Yellow River Basin. Results showed that OVG incorporation with 25% N reduction (N2 treatment) significantly reduced total gaseous N emissions by 36.07% on average during the cotton growth period, reducing NH3 and N2O emissions by 13.31-54.11% and 32.25-68.77%, respectively, compared with N2 application without OVG. OVG application also increased the relative abundance of Proteobacteria (28.10%), enhanced heterogeneous selection in bacterial community assembly (200%), and increased the complexity of co-occurrence networks, compared with NG. Compared with conventional N fertilization (N3 treatment), ≥50% N reduction significantly lowered NH3 (>25.51%) and N2O (>32.76%) emissions, reduced the relative abundance of Acidobacteria (-20.23%), simplified co-occurrence networks, and increased homogeneous selection in bacterial assembly (50.00%). Integrating green manure with 25% N reduction substantially reduced gaseous N emissions, which was associated with the enhanced microbial biomass carbon (MBC) and facilitated recruitment of key bacterial taxa (e.g., Sphingosinicella, Azohydromonas, Phototrophicus) within the microbial co-occurrence network. These findings provide insight into how green manure application coupled with N reduction can mitigate gaseous N losses and reshape soil microbial ecology, offering a theoretical basis for sustainable nutrient management during cotton production.
Keywords: N fertilizer reduction; N2O emissions; NH3 volatilization; bacterial keystone taxa; green manure.
Copyright © 2025 Ma, Zhang, Wang, Han, Li, Hou, Lei, Xiong, Yang, Zhi, Jiao, Lin, Zhang and Li.
Conflict of interest statement
The authors declare that the research was conducted in the absence of any commercial or financial relationships that could be construed as a potential conflict of interest.
Figures


Similar articles
-
[Effects of Green Manure and Nitrogen Application on Soil Carbon Fractions in a Dryland Winter Wheat Field].Huan Jing Ke Xue. 2025 Jun 8;46(6):3856-3864. doi: 10.13227/j.hjkx.202405018. Huan Jing Ke Xue. 2025. PMID: 40582820 Chinese.
-
Effects of subsurface drip irrigation and nitrogen fertilizer management on N2O emissions and forage yield in alfalfa production.Front Plant Sci. 2025 Jun 3;16:1598110. doi: 10.3389/fpls.2025.1598110. eCollection 2025. Front Plant Sci. 2025. PMID: 40530270 Free PMC article.
-
New trends in sugarcane fertilization: Implications for NH3 volatilization, N2O emissions and crop yields.J Environ Manage. 2023 Sep 15;342:118233. doi: 10.1016/j.jenvman.2023.118233. Epub 2023 Jun 3. J Environ Manage. 2023. PMID: 37276616
-
Assessing the comparative effects of interventions in COPD: a tutorial on network meta-analysis for clinicians.Respir Res. 2024 Dec 21;25(1):438. doi: 10.1186/s12931-024-03056-x. Respir Res. 2024. PMID: 39709425 Free PMC article. Review.
-
Prevalence and odds of anxiety and depression in cutaneous malignant melanoma: a proportional meta-analysis and regression.Br J Dermatol. 2024 Jun 20;191(1):24-35. doi: 10.1093/bjd/ljae011. Br J Dermatol. 2024. PMID: 38197404
References
-
- Adetunji A. T., Ncube B., Mulidzi R., Lewu F. B. (2020). Management impact and benefit of cover crops on soil quality: a review. Soil Tillage Res. 204:104717. doi: 10.1016/j.still.2020.104717 - DOI
LinkOut - more resources
Full Text Sources

