. 2025 Jun 16;6(7):e70190.
doi: 10.1002/mco2.70190. eCollection 2025 Jul.

Genetic Subtype-Based International Prognostic Index Prognostic Model in Diffuse Large B-Cell Lymphoma

Affiliations

Genetic Subtype-Based International Prognostic Index Prognostic Model in Diffuse Large B-Cell Lymphoma

Lan Mi et al. MedComm (2020). .

Abstract

Molecular subtyping in diffuse large B-cell lymphoma (DLBCL) leads to facilitating drug selection. However, an integrated prognostic model based on molecular subtyping and clinical features has not been well established. Here, we retrospectively performed whole genome sequencing, whole exome sequencing, and fluorescence in situ hybridization in newly diagnosed DLBCLs, established a simplified LymphType algorithm for classification evaluation, and proposed a new integrated prognostic stratification system, combined molecular subtypes and International Prognostic Index (IPI) scoring system in our in-house sequencing cohort (N = 100), and validated in three public cohorts (N = 1480). Compared with IPI scoring system and classification algorithm model alone, the discrimination ability of prognostic model based on the new integrated model showed best discrimination of overall survival with concordance index value (0.773 vs. 0.724 vs. 0.648). We subsequently established a four-category risk model defined for the integrated prognostic model as follows: low, low-intermediate, high-intermediate, and high risk, demonstrating stronger prognostic separation across all end points (all p < 0.001) in our in-house cohort and three validation cohorts. Collectively, the new feasible integrated prognostic stratification system contributes to accurate prognosis assessment in clinical routine and provides a new basis for the follow-up treatment.

Keywords: International Prognostic Index; LymphType; defined genetic subtype; diffuse large B‐cell lymphoma; integrated prognostic model.


Conflict of interest statement

Authors Jiayue Qin, Lixia Liu, Shunli Yang, Libin Chen, Hong Chen, Feng Lou, and Shanbo Cao are the employees of Acornmed Biotechnology Co., Ltd., but has no potential relevant financial or nonfinancial interests to disclose. The other authors declare no conflicts of interest.

Figures

FIGURE 1
FIGURE 1
Enrolment of study cohort. DLBCL, diffuse large B‐cell lymphoma; R‐CHOP, rituximab, cyclophosphamide, doxorubicin hydrochloride, vincristine, and prednisone; WGS, whole genome sequencing; WES, whole exome sequencing; FISH, fluorescence in situ hybridization; IPI, International Prognostic Index; NA, not appliable.
FIGURE 2
FIGURE 2
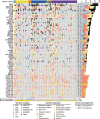
Genomic landscape in the training cohort. Heatmap shows top specific mutated genes in gene mutations, gene CNVs, and chromosomal CNVs in each patient, detected in ≥15% patients. CNV, copy number variation.
FIGURE 3
FIGURE 3
Genetic characteristics in the training cohort. (A) Bubble chart illustrates the mutation analysis of KEGG pathways. (B) Mutational signatures are displayed according to the 96 substitution classification defined by the different substitution class. Volcano plots display the correlation between gene mutations in mutated genes detected in ≥15% patients, and age (C), Hans COO classification (D), stage (E), invasion organ (F), IPI (G), and DE (H), respectively. KEGG, Kyoto Encyclopedia of Genes and Genomes; GCB, germinal center B‐cell like; IPI, International Prognostic Index; DE, BCL2/MYC double expressors.
FIGURE 4
FIGURE 4
Performance evaluation of full and simplified versions of LymphType algorithm. (A) Sankey plot shows the comparison of the full version of LymphType and LymphGen algorithms in NCI cohort. (B) Pie chart displays the defined genetic subtypes based on full version of LymphType algorithm in PKUCH cohort. (C) Histogram shows the comparison between different genetic subtypes based on full version of LymphType algorithm in primary lymphatic node and extranodal lymphomas in PKUCH cohort. (D) Kaplan–Meier survival curve shows the prognostic effect of OS in PKUCH cohort according to full version of LymphType algorithm. (E) Sankey plot shows the comparison of the simplified version and full version of LymphType algorithm in PKUCH cohort. (F) Confusion matrix displays the number of matches in each defined genetic subtype based on the full and simplified versions of LymphType in PKUCH cohort. OS, overall survival.
FIGURE 5
FIGURE 5
Predictive performance evaluation of the integrated IPI‐G prognostic model. (A) Ten‐fold cross validation curve for tuning parameter selection. The vertical and horizontal axis represents mean square error and λ, respectively. (B) The coefficient curve for tuning parameter. The vertical and horizontal axis represents the feature's coefficient and λ, respectively. (C) Nomogram model for predicting OS. (D) Predictive performance based on C‐index comparisons in three models, including IPI‐G, IPI, G models. (E) ROCs represent the predictive performances in the three models in the training PKUCH cohort. (F) Four‐category risk group defined for the integrated IPI‐G prognostic model. LASSO, least absolute shrinkage and selection operator; λ, lambda; OS, overall survival; C‐index, concordance index; IPI, International Prognostic Index; IPI‐G, genetic subtype‐based IPI; G, genetic subtype; ROC, receiver operating characteristic curve; LR, low risk; LIR, low‐intermediate risk; HIR, high‐intermediate risk; HR, high risk.
FIGURE 6
FIGURE 6
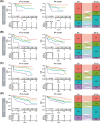
The four‐category risk model defined for the integrated IPI‐G prognostic model. Kaplan–Meier survival curves and Sankey plots based on four‐category integrated IPI‐G prognostic model, compared with IPI model, in the training PKUCH cohort (A), and the validation NCI cohort (B), BCA cohort (C), and DHP cohort (D), respectively. OS, overall survival; IPI, International Prognostic Index; IPI‐G, genetic subtype‐based IPI; LR, low risk; LIR, low‐intermediate risk; HIR, high‐intermediate risk; HR, high risk.

References

    1. Swerdlow S. H., Campo E., Pileri S. A., et al., “The 2016 Revision of the World Health Organization Classification of Lymphoid Neoplasms,” Blood 127, no. 20 (2016): 2375–2390. - PMC - PubMed
    1. Alaggio R., Amador C., Anagnostopoulos I., et al., “The 5th Edition of the World Health Organization Classification of Haematolymphoid Tumours: Lymphoid Neoplasms,” Leukemia 36, no. 7 (2022): 1720–1748. - PMC - PubMed
    1. Hilton L. K., Scott D. W., and Morin R. D., “Biological Heterogeneity in Diffuse Large B‐cell Lymphoma,” Seminars in Hematology 60, no. 5 (2023): 267–276. - PubMed
    1. Younes A., Brody J., Carpio C., et al., “Safety and Activity of ibrutinib in Combination With nivolumab in Patients With Relapsed non‐Hodgkin Lymphoma or Chronic Lymphocytic Leukaemia: A Phase 1/2a Study,” The Lancet Haematology 6, no. 2 (2019): e67–e78. - PubMed
    1. Xu P. P., Fu D., Li J. Y., et al., “Anthracycline Dose Optimisation in Patients With Diffuse Large B‐cell Lymphoma: A Multicentre, Phase 3, Randomised, Controlled Trial,” The Lancet Haematology 6, no. 6 (2019): e328–e337. - PubMed

LinkOut - more resources