

Global, regional and national burden of traumatic amputations from 1990 to 2021: a systematic analysis of the Global Burden of Disease study 2021
- PMID: 40529681
- PMCID: PMC12171122
- DOI: 10.3389/fpubh.2025.1583523
Global, regional and national burden of traumatic amputations from 1990 to 2021: a systematic analysis of the Global Burden of Disease study 2021
Abstract
Background: Traumatic amputations are serious public health problems with enormous health and economic costs, but to date there has been little research on the epidemiology of traumatic amputations. We aimed to comprehensively analyze the global burden of disease due to traumatic amputations during 1990-2021 and to project trends over the next 15 years.
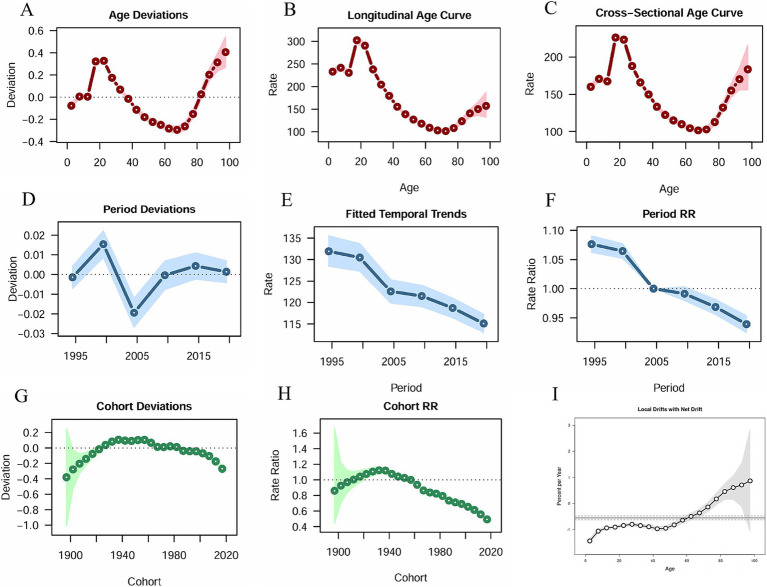
Method: Global Burden of Disease (GBD) 2021 data were used to demonstrate the burden of traumatic amputations in different populations, including incidence, prevalence, and years lived with disability (YLDs). In-depth analyses and projections were performed using Age-Period-Cohort (APC) model analysis, decomposition analysis, and Autoregressive Integrated Moving Average (ARIMA) models.
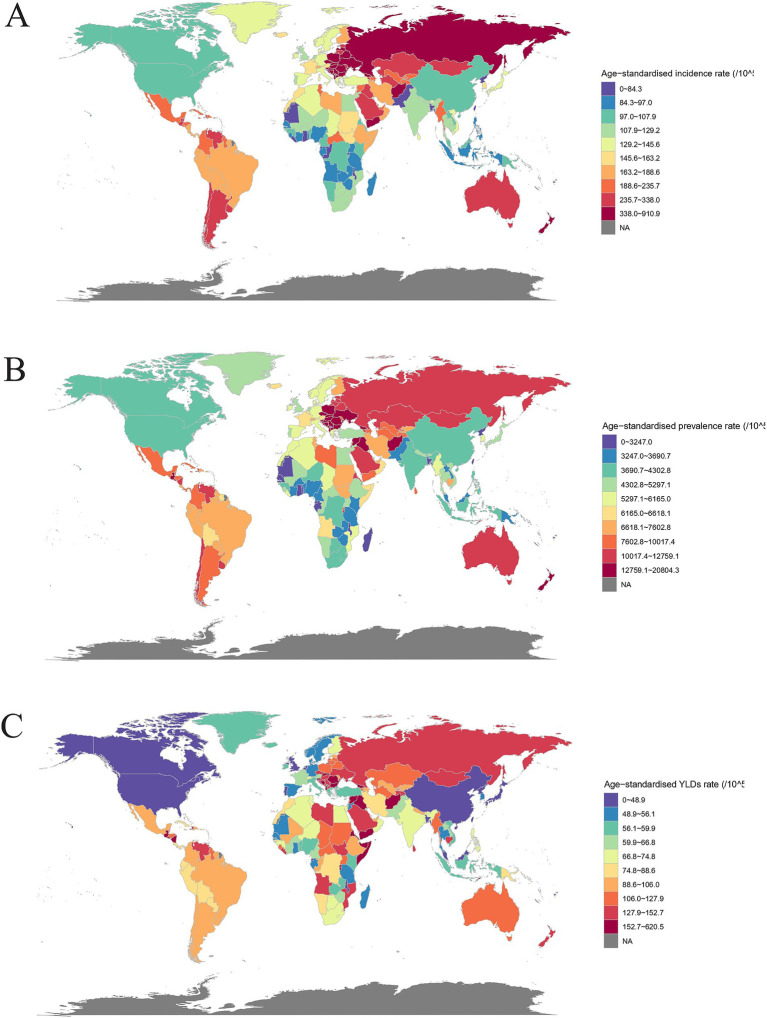
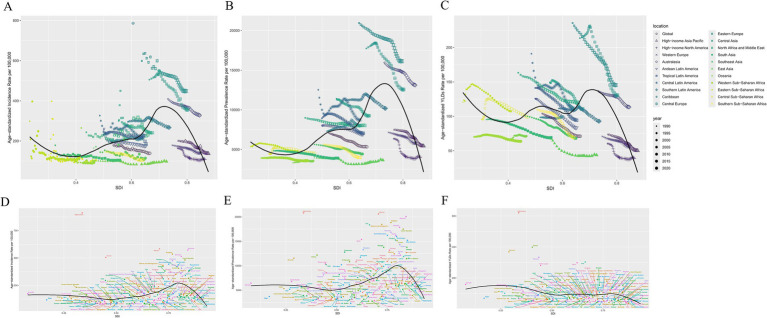
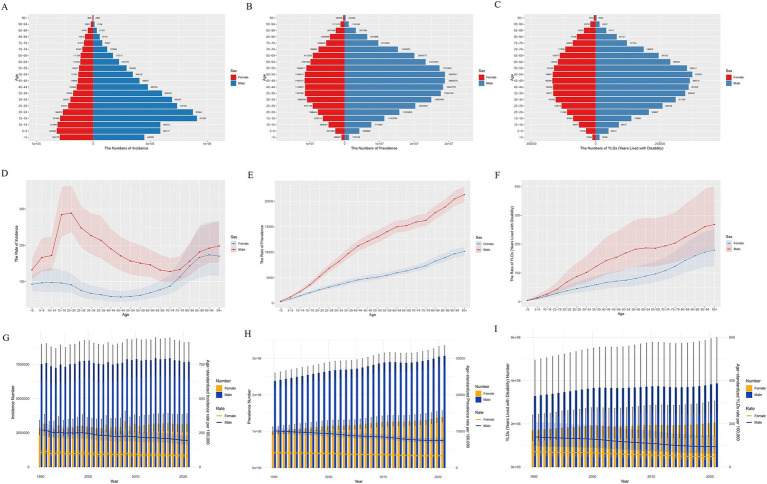
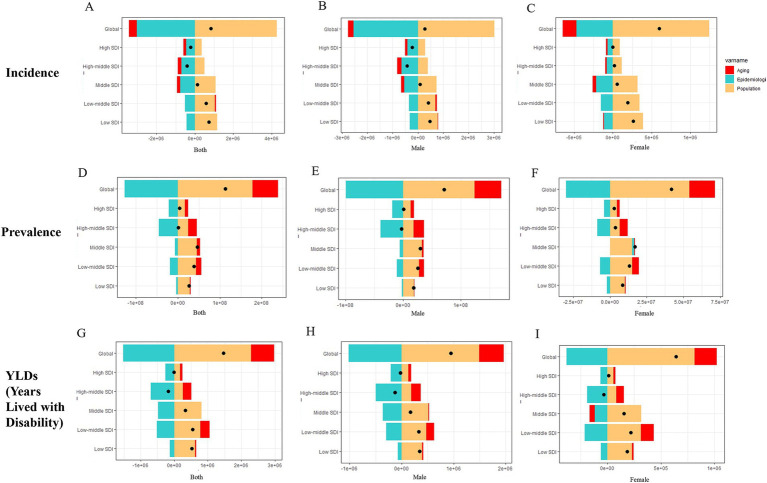
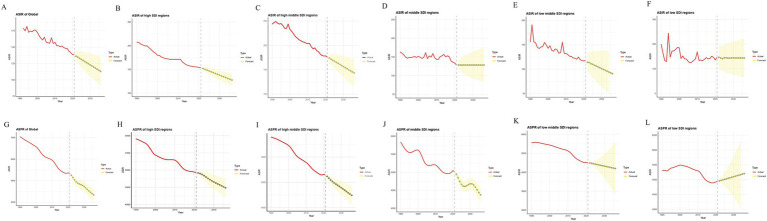
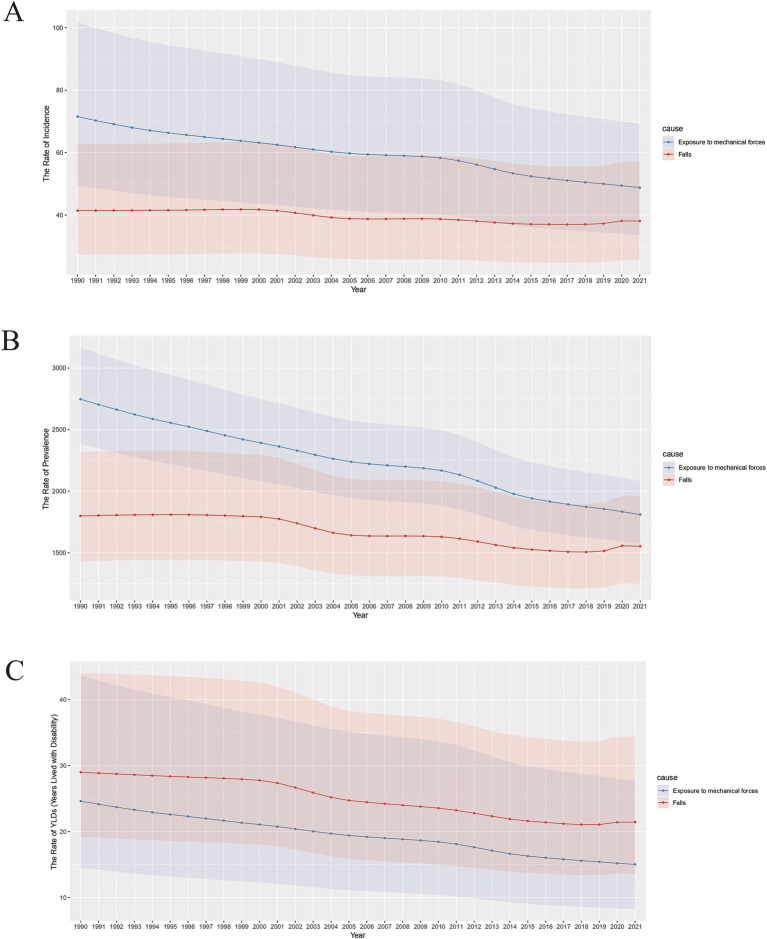
Result: There was an increase in the number of traumatic amputations globally in 2021 compared to 1990. However, the change in age-standardized rates from 1990 to 2021 declined significantly. The association between the Socio-demographic Index (SDI) and the burden of amputations in 2021 was not linear. Results of the APC analysis indicated that the burden was lower in the later-born cohort and showed an overall decreasing trend over time. The results of the decomposition analyses indicated that in most cases age change suppressed incidence but promoted increases in prevalence and YLDs. Population changes increased the burden of amputations, while epidemiologic changes did the opposite. The burden was projected to trend downward globally and in most regions over the next 15 years. Finally, mechanical forces and falls were the two most prominent factors.
Conclusion: The global burden of traumatic amputations increased in number from 1990 to 2021, but the age-standardized rate declined significantly and was expected to continue to decline in the future. Population growth is now the main cause of the burden, and more attention needs to be paid to men, youth and the older adult.
Keywords: amputation; disease burden; epidemiology; global health; trauma.
Copyright © 2025 Wei, Zhang, Cheng and Wu.
Conflict of interest statement
The authors declare that the research was conducted in the absence of any commercial or financial relationships that could be construed as a potential conflict of interest.
Figures
References
MeSH terms
LinkOut - more resources
Full Text Sources
Medical