

Estimating the optimal number of samples to determine the effective population size in livestock
- PMID: 40529807
- PMCID: PMC12170570
- DOI: 10.3389/fgene.2025.1588986
Estimating the optimal number of samples to determine the effective population size in livestock
Abstract
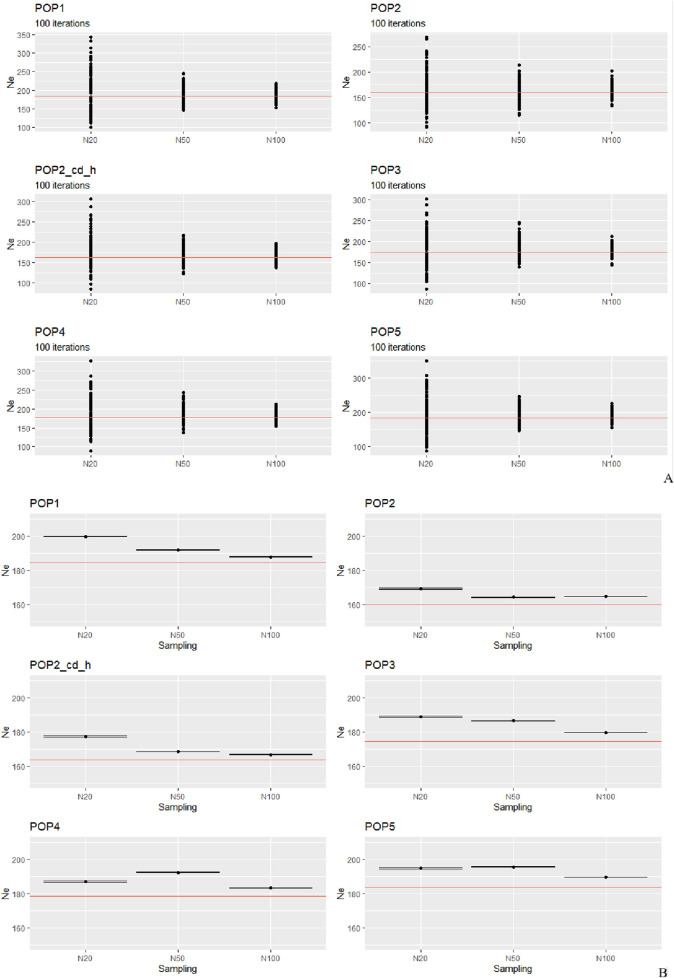
Effective population size (Ne) is a key parameter in various biological disciplines, including evolutionary biology, conservation genetics, and livestock breeding programs. When applying genomic approaches to estimate Ne or other indicators of genetic variation, sample size is among the critical factors that directly affect the balance between cost and precision. In this study, we investigated the impact of sample size on Ne estimates by analyzing data from previous genotyping studies and simulations. Our results suggest that a sample size of 50 animals is a reasonable approximation of the "true" ("unbiased") Ne value within the populations analyzed. While estimating the Ne value is an important starting point in population genetics, additional factors, such as the degree of inbreeding, population structure, and admixture, must be taken into account to obtain a comprehensive genetic evaluation and avoid misinterpretation. We conclude that linkage disequilibrium (LD)-based approaches are well suited for the estimation of Ne in livestock populations. However, careful interpretation of results is essential as current bioinformatics tools may introduce potential biases due to methodological assumptions, marker density, or population-specific factors.
Keywords: SNP arrays; conservation; effective population size; simulation; small ruminants.
Copyright © 2025 Manunza, Cozzi, Boettcher, Curik, Looft, Colli, Sölkner, Mészáros and Stella.
Conflict of interest statement
The authors declare that the research was conducted in the absence of any commercial or financial relationships that could be construed as a potential conflict of interest. The author(s) declared that they were an editorial board member of Frontiers at the time of submission. This had no impact on the peer review process and the final decision.
Figures

Similar articles
-
Assessing the comparative effects of interventions in COPD: a tutorial on network meta-analysis for clinicians.Respir Res. 2024 Dec 21;25(1):438. doi: 10.1186/s12931-024-03056-x. Respir Res. 2024. PMID: 39709425 Free PMC article. Review.
-
Platelet Indices and RDW to Assess Inflammatory Milieu in Subclinical Hashimoto's Thyroiditis.Clin Med Insights Endocrinol Diabetes. 2025 Jun 13;18:11795514251349337. doi: 10.1177/11795514251349337. eCollection 2025. Clin Med Insights Endocrinol Diabetes. 2025. PMID: 40528863 Free PMC article.
-
The ultimate power play in research - partnering with patients, partnering with power.Res Involv Engagem. 2025 Jun 17;11(1):65. doi: 10.1186/s40900-025-00745-9. Res Involv Engagem. 2025. PMID: 40528262 Free PMC article.
-
Molecular feature-based classification of retroperitoneal liposarcoma: a prospective cohort study.Elife. 2025 May 23;14:RP100887. doi: 10.7554/eLife.100887. Elife. 2025. PMID: 40407808 Free PMC article.
-
Defining disease severity in atopic dermatitis and psoriasis for the application to biomarker research: an interdisciplinary perspective.Br J Dermatol. 2024 Jun 20;191(1):14-23. doi: 10.1093/bjd/ljae080. Br J Dermatol. 2024. PMID: 38419411 Free PMC article. Review.
References
-
- Ajmone-Marsan P., Boettcher P. J., Colli L., Ginja C., Kantanen J., Lenstra J. A. (2023). Genomic characterization of animal genetic resources–practical guide. FAO Animal Production and Health Guidelines No. 32. Rome, Italy: FAO. 10.4060/cc3079en - DOI
-
- Álvarez I., Royo L. J., Gutiérrez J. P., Fernández I., Arranz J. J., Goyache F., et al. (2008). Relationship between genealogical and microsatellite information characterizing losses of genetic variability: empirical evidence from the rare Xalda sheep breed. Livest. Sci. 115, 80–88. 10.1016/j.livsci.2007.06.009 - DOI
-
- Beichman A. C., Huerta-Sanchez E., Lohmueller K. E. (2018). Using genomic data to infer historic population dynamics of nonmodel organisms. Annu. Rev. Ecol. Evol. Syst. 49, 433–456. 10.1146/annurev-ecolsys-110617 - DOI
LinkOut - more resources
Full Text Sources
Research Materials