

Injectable thermosensitive hydrogel co-loading with ATRi and doxorubicin for the treatment of triple-negative breast cancer
- PMID: 40530304
- PMCID: PMC12168770
- DOI: 10.1039/d5ra03120f
Injectable thermosensitive hydrogel co-loading with ATRi and doxorubicin for the treatment of triple-negative breast cancer
Abstract
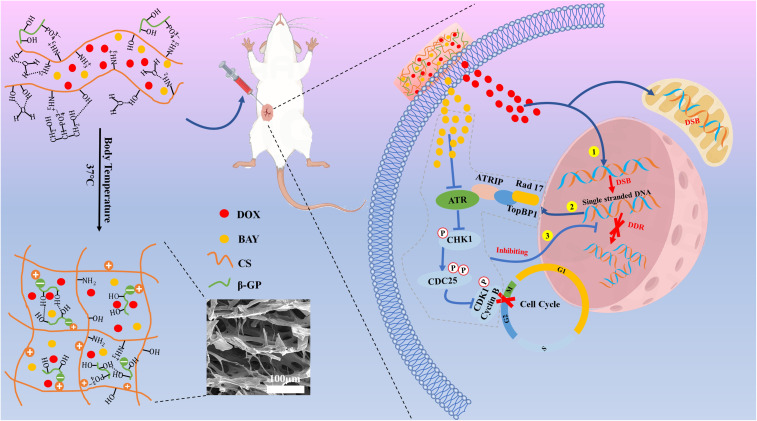
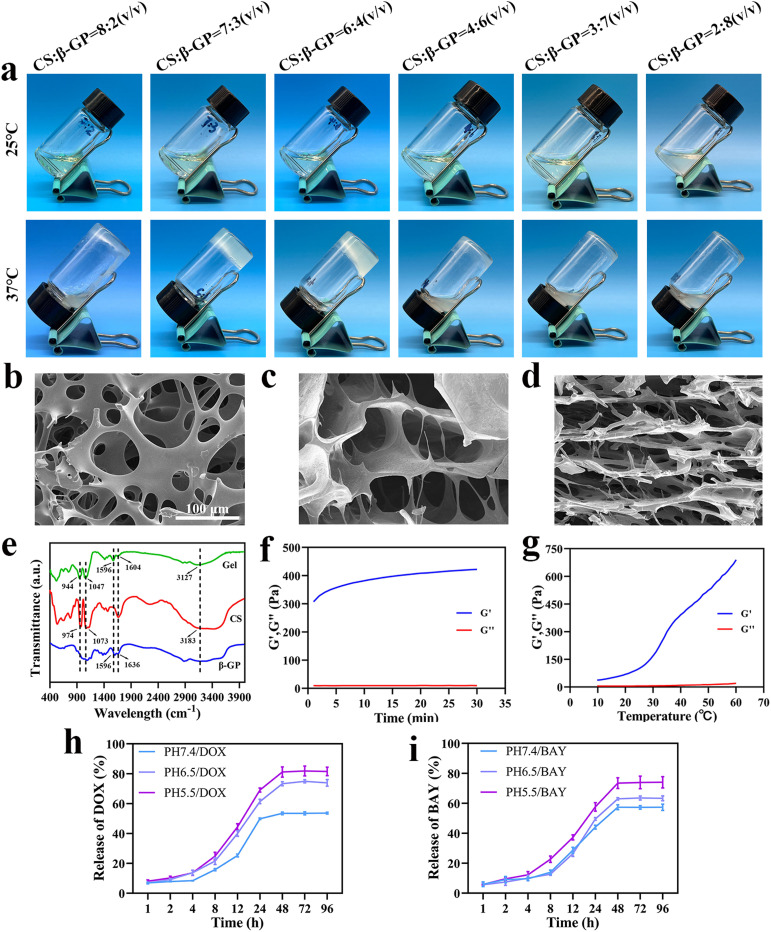
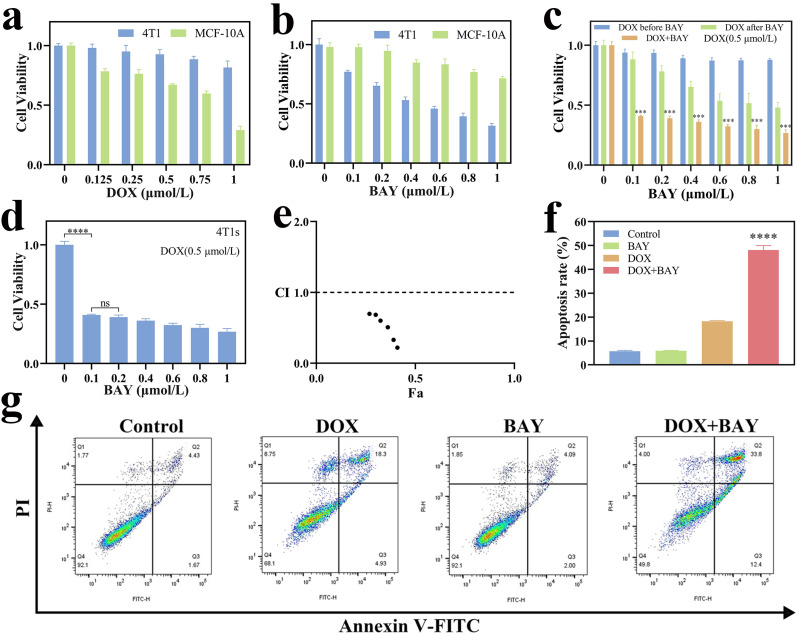
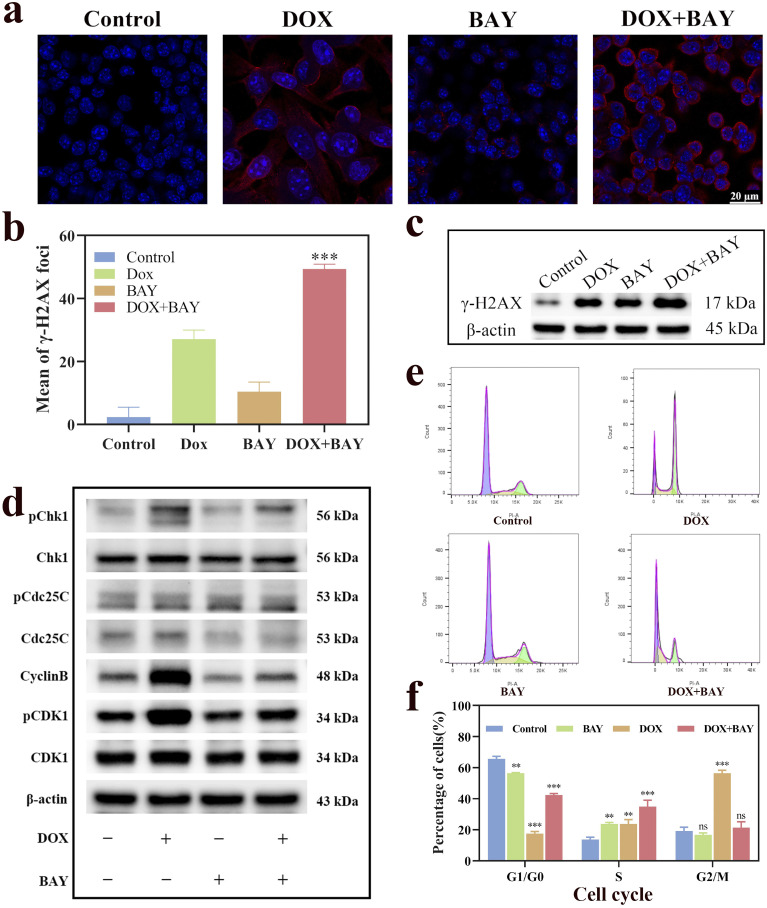
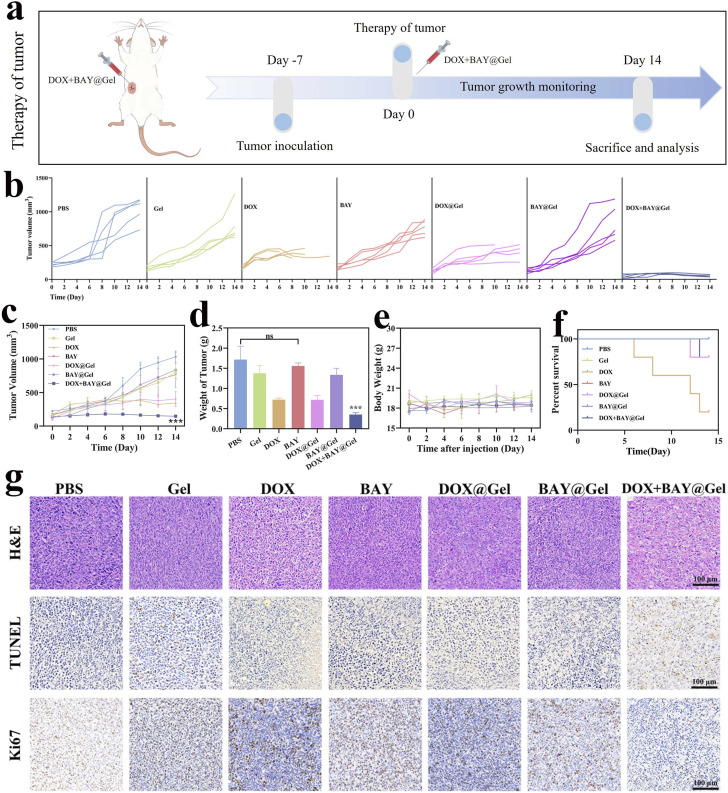
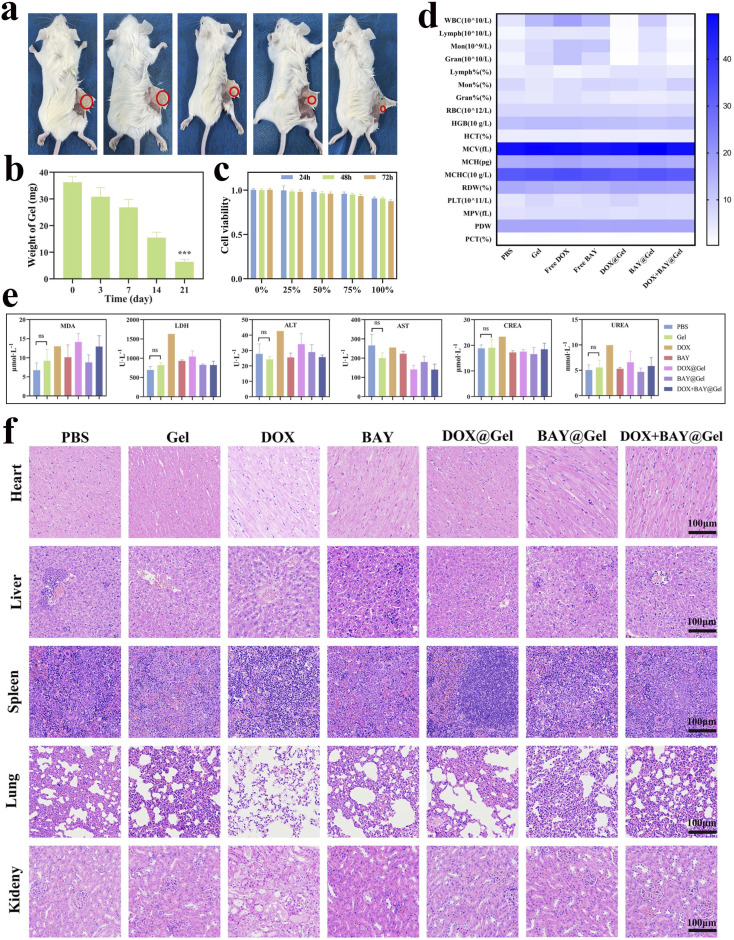
Chemotherapy has been the first-line treatment option for cancer. However, acquired chemo-resistance led by DNA damage repair (DDR) of cancer cells and serious side-effects of chemotherapeutic agents are huge hurdles to effectively suppress metastatic tumors. Herein, we developed an injectable thermosensitive hydrogel for localized co-delivery of ATRi-BAY-1895344 (BAY) and doxorubicin (DOX), serving as a localized drug depot to minimize systemic toxicity while ensuring sustained tumor-specific drug release exceeding 4 days. The in vitro cumulative drug release rate of DOX and BAY reached up to 73.9% and 63.3% under pH 6.5 conditions. This study pioneers the synergistic combination of a DNA-damaging agent and Ataxia telangiectasia and RAD3-related (ATR) kinase inhibitor ATRi to disrupt the DDR pathway. The ATRi-mediated inhibition of ATR kinase effectively disrupts the replication stress response by impairing the repair of DOX-induced DNA lesions. This dual mechanism significantly enhances tumor cell vulnerability to chemotherapy, ultimately achieving an 8-fold increase in chemosensitivity compared to monotherapy regimens. In triple-negative breast cancer models, the hydrogel-based DOX + BAY@Gel formulation achieved a tumor inhibition rate of 79.4%, significantly surpassing the 58% observed with free DOX monotherapy. This dual-action strategy overcomes chemo-resistance by disabling DDR compensatory mechanisms and prolongs tumor suppression through controlled drug release. The hydrogel platform represents a functional innovation in localized combination therapy, integrating stimuli-responsive drug delivery with DDR pathway disruption for synergistic efficacy.
This journal is © The Royal Society of Chemistry.
Conflict of interest statement
The authors declare that they have no conflict of interest.
Figures
Similar articles
-
ATR inhibition increases reliance on PARP-mediated DNA repair revealing an improved therapeutic strategy for cervical cancer.Gynecol Oncol. 2024 Dec;191:182-193. doi: 10.1016/j.ygyno.2024.10.009. Epub 2024 Oct 19. Gynecol Oncol. 2024. PMID: 39427557
-
Multi-Focused Acoustic Radiation Force Impulse Modulation of Murine Hepatic Xenografts Enhances Nanoscale DOX@Lip Delivery and Therapeutic Effect.Int J Nanomedicine. 2025 Jun 12;20:7359-7373. doi: 10.2147/IJN.S522247. eCollection 2025. Int J Nanomedicine. 2025. PMID: 40529535 Free PMC article.
-
Regulating inflammation microenvironment and tenogenic differentiation as sequential therapy promotes tendon healing in diabetic rats.J Orthop Translat. 2025 Jun 5;53:63-81. doi: 10.1016/j.jot.2025.04.015. eCollection 2025 Jul. J Orthop Translat. 2025. PMID: 40529900 Free PMC article.
-
Defining disease severity in atopic dermatitis and psoriasis for the application to biomarker research: an interdisciplinary perspective.Br J Dermatol. 2024 Jun 20;191(1):14-23. doi: 10.1093/bjd/ljae080. Br J Dermatol. 2024. PMID: 38419411 Free PMC article. Review.
-
Olaparib Monotherapy or in Combination with Abiraterone for the Treatment of Patients with Metastatic Castration-Resistant Prostate Cancer (mCRPC) and a BRCA Mutation.Target Oncol. 2025 May;20(3):445-466. doi: 10.1007/s11523-025-01146-4. Epub 2025 May 21. Target Oncol. 2025. PMID: 40397306 Free PMC article. Review.
References
-
- Yuan P. Xu B. H. Chin. J. Oncol. 2024;46:471–480.
-
- Zhang Z. Wang Y. Ma Q. Zhang S. Liu H. Zhao B. Liu R. Wang W. Du B. Zhong Y. Kong D. Chem. Eng. J. 2021;406:126801.
-
- Weintraub J. L. Salem R. J. Vasc. Intervent. Radiol. 2013;24:1123–1134. - PubMed
LinkOut - more resources
Full Text Sources
Miscellaneous