. 2025 Jun 2:13:1574690.
doi: 10.3389/fcell.2025.1574690. eCollection 2025.

Gonadotropins differentially regulate testicular cell adhesion and junctional complexes during flatfish spermiogenesis through the oxytocin and relaxin signaling pathways

Affiliations

Gonadotropins differentially regulate testicular cell adhesion and junctional complexes during flatfish spermiogenesis through the oxytocin and relaxin signaling pathways

Noelia López-Fortún et al. Front Cell Dev Biol. .

Abstract

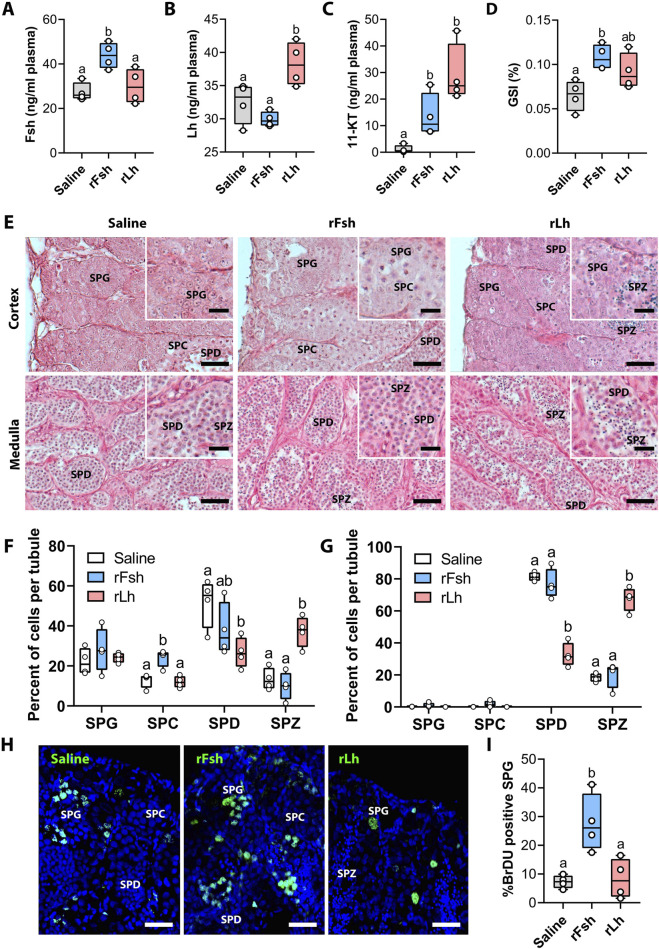
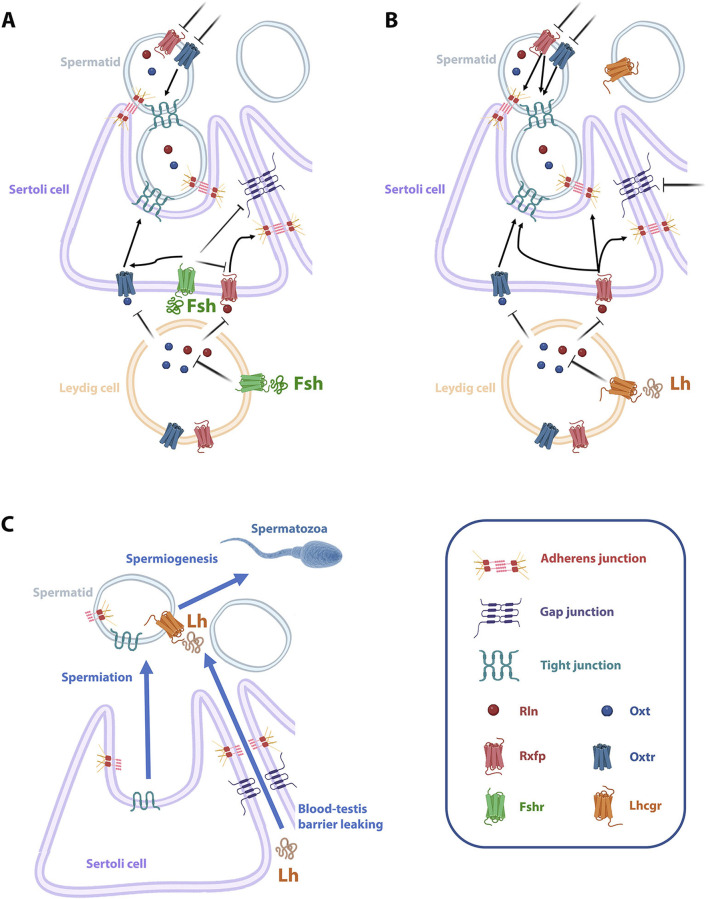
Introduction: The molecular mechanisms regulating teleost semicystic spermatogenesis remain largely unknown. In the flatfish Senegalese sole (Solea senegalensis), haploid round spermatids released into the lumen of the seminiferous tubules resume spermiogenesis (the differentiation of germ cells into spermatozoa) in response to the luteinizing hormone (Lh). However, how the spermatids detach from Sertoli cells and how Lh crosses the blood-testis barrier (BTB) are yet to be determined.

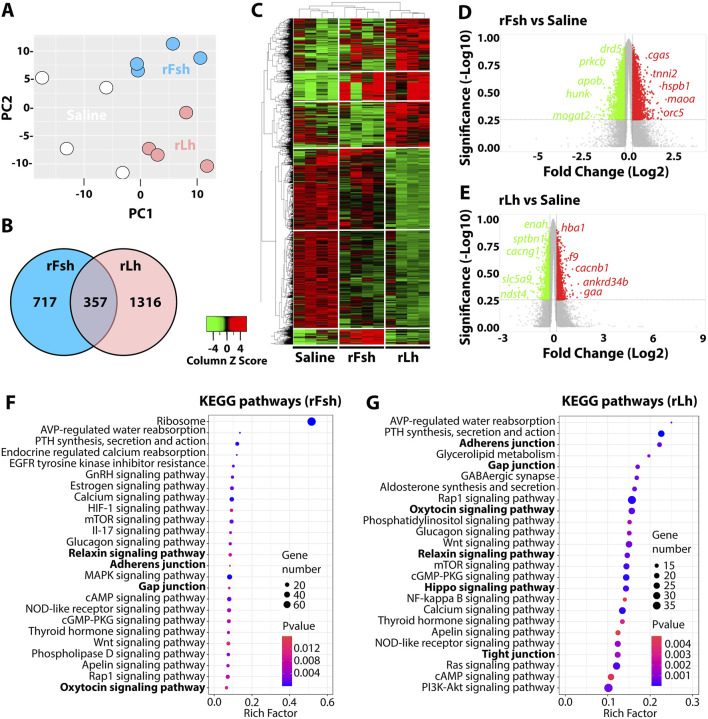
Methods: Here, we used an RNA-seq transcriptomic analysis of the testis from sole males treated with recombinant follicle stimulating hormone and Lh (rFsh and rLh, respectively).

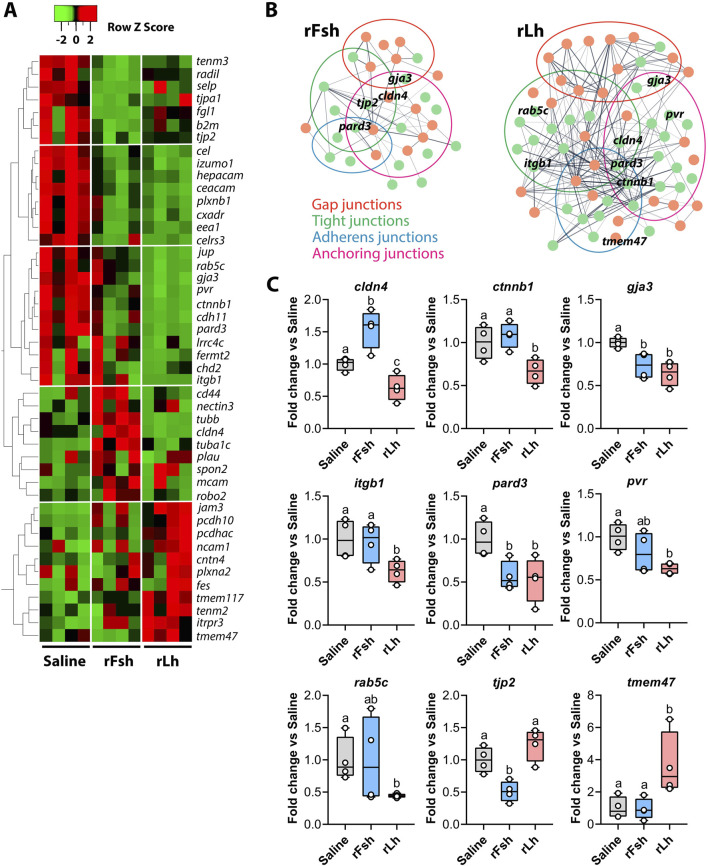
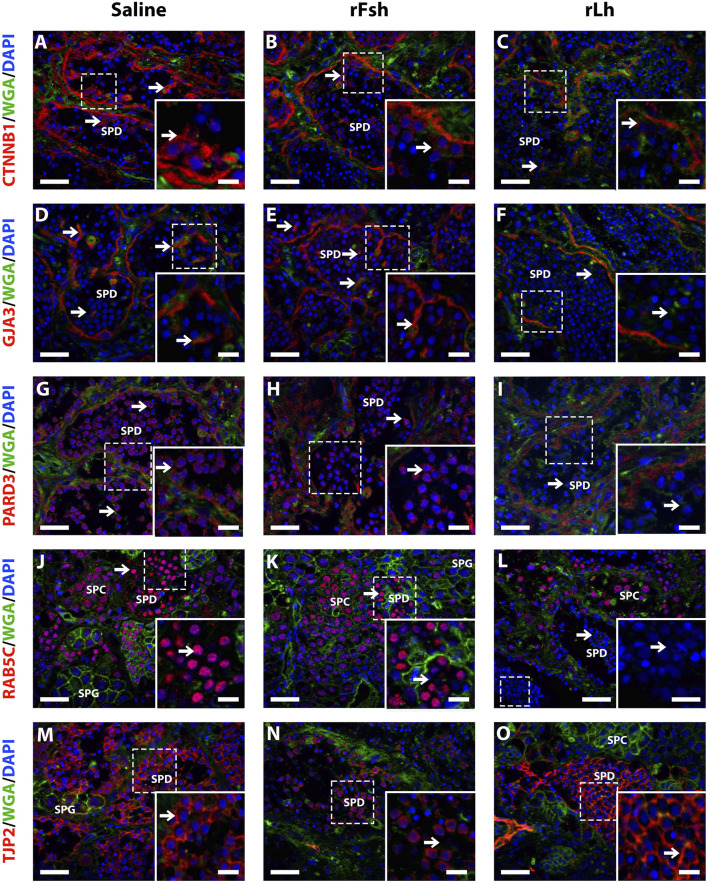
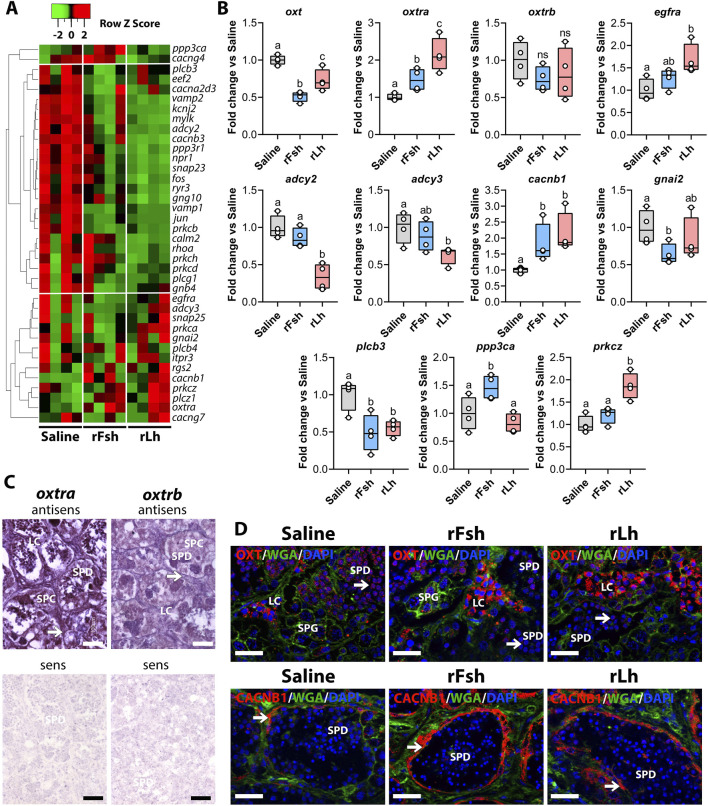
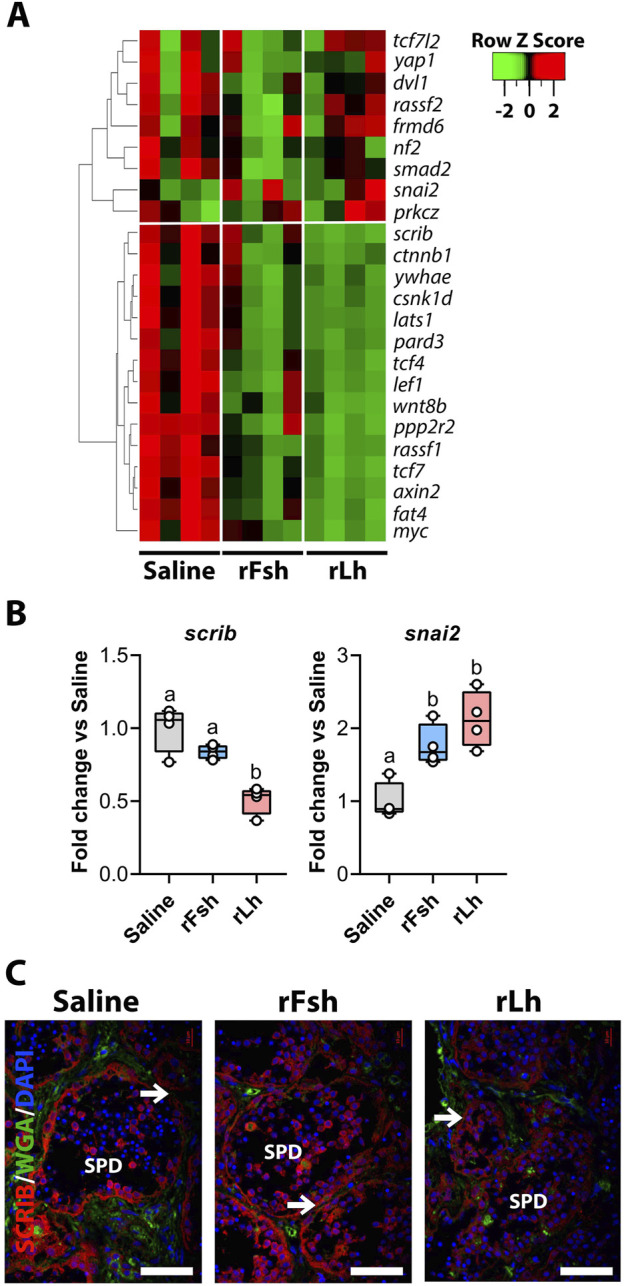
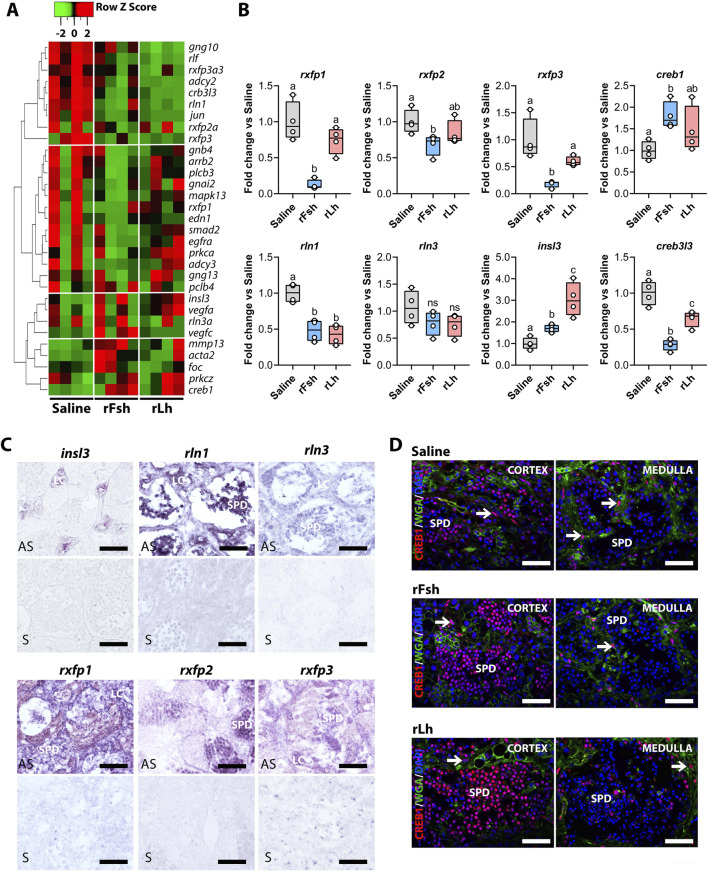
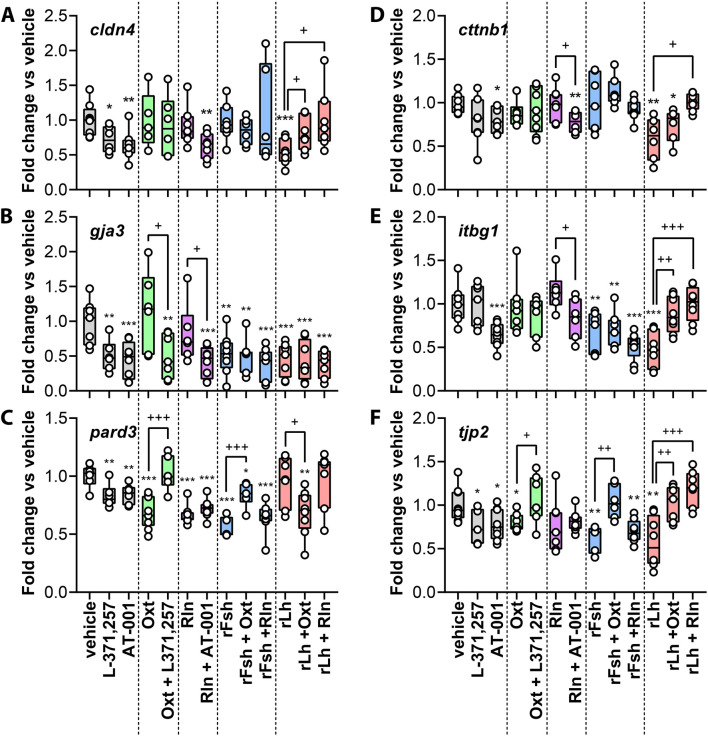
Results: This analysis reveals that both gonadotropins differentially downregulate a number of transcripts potentially encoding cell-cell junction and adhesion proteins, as well as components of the Oxytocin (Oxt) and Relaxin (Rln) signaling pathways. In situ hybrizidation and immunolocalization experiments confirmed the formation of adherens, gap, and tight junctions between Sertoli cells, and between Sertoli cells and spermatids. Using these methods, we also verified the expression of Oxt and Rln peptides and their cognate receptors in these cells. Further in vitro assays using testicular explants incubated with Oxt, Rln and inhibitors of their receptors, combined with rFsh or rLh, showed that the gonadotropic-induced transcriptional repression of cell junction and adhesion genes in the seminiferous epithelium, particularly by Lh, was largely mediated by the downregulation of Oxt and Rln signaling.

Discussion: These data suggest that the Oxt- and Rln-mediated gonadotropic disruption of the BTB and Sertoli cells-spermatid junctions in the sole testis facilitates spermatid release and Lh paracellular transport into the seminiferous lumen during spermiogenesis.

Keywords: adherens junctions; blood-testis barrier; cell junctions; endocrine control; spermatogenesis; teleost.


Conflict of interest statement

Authors JR-G and IG were employed by Rara Avis Biotec, S.L. The remaining authors declare that the research was conducted in the absence of any commercial or financial relationships that could be construed as a potential conflict of interest.

Figures

FIGURE 1
FIGURE 1
Circulating hormone levels, gonad weight and proliferation of testicular germ cells in males treated with rFsh or rLh. (A–C) Plasma levels of Fsh (A), Lh (B) and 11-KT (C) under the different treatments (saline, rFsh or rLh) for six consecutive weeks, measured 1 week after the last injection. (D) Gonadosomatic index (GSI), calculated as gonad mass relative to total body mass, under the different hormone treatments. (E) Representative photomicrographs of histological sections from the testicular cortical and medullar regions. Scale bars, 10 μm (Inset, 3 µm). SPG, spermatogonia; SPC, spermatocyte; SPD, spermatid; SPZ, spermatozoa. (F,G) Percentage of germ cells in the cortical (F) and medullar (G) regions of the testis from males treated with rFsh or rLh. (H) Immunostaining of BrdU, highlighting proliferating SPG (in green), which indicates active cell division under the different treatments. Scale bars, 30 µm (I) Quantification of BrdU-positive SPG under the different treatments. In A-D, F, G and I, data are presented as box and whisker plots/scatter dots with horizontal line (inside box) indicating median and outliers (n = 4 fish, white dots), and were statistically analyzed by one-way ANOVA followed by the Tukey’s multiple comparison test. Bars with different superscript are significantly different (P < 0.05).
FIGURE 2
FIGURE 2
RNA-seq analysis of testis from Senegalese sole males treated with rFsh or Lh. (A) Principal component analysis (PCA) of the top 500 differentially expressed genes (DEGs) in testes from males treated with saline (control), rFsh or rLh (n = 4). (B) Venn diagrams showing the number of rFsh- and rLh-specific and common DEGs (in intersect region) with respect to the control group. (C) Heatmap generated by hierarchical clustering of RNA-seq expression z-scores computed for the 2390 DEGs (p-adj <0.01; Log2 fold change >0.5) between treatments. (D,E) Volcano plots of DEGs in the rFsh- (D) and rLh-treated (E) groups with respect to the control group. The x-axis shows Log2 fold changes in expression and the y-axis the negative logarithm of their p-value to base 10. Red and green dot mark the genes with significantly increased or decreased expression respectively (FDR <0.01). The most regulated transcripts in each case are indicated. (F,G) Canonical pathways related to DEG in the testis of rFsh- (F) and rLh-treated (G) males identified using the PANTHER classification system. The plot shows the 25 most highly enriched signaling pathways (FDR <0.05) in the testis, with the Rln, Oxt and cell-cell adhesion pathways highlighted in bold lettering. The X-axis shows the rich factor while the Y-axis shows the KEGG pathway. A high and low P-value is represented by blue and red, respectively.
FIGURE 3
FIGURE 3
Gonadotropins regulate the expression of cell adhesion molecules. (A) Heatmap generated for the DEGs related to cell adhesion molecules (CAMs) as indicated by the PANTHER pathway: gap junctions, adherens junctions and tight junctions. (B) Representation of the protein-protein interaction (PPI) networks of DEGs related to CAMs specifically regulated by rFsh (left) or rLh (right). The different colored circles group the DEGs according to the type of junctions where the protein products are potentially located. Representative transcripts from each group are annotated. (C) Validation of the RNA-seq data by RT-qPCR for selected genes: claudin 4 (cldn4), catenin beta 1 (ctnnb1), gap junction protein alpha 3 (gja3), integrin subunit beta 1 (itgb1), par-3 family cell polarity regulator (pard3), poliovirus receptor (pvr), RAS oncogene family 5c (rab5c), tight junction protein 2 (tjp2), and transmembrane protein 42 (tmem42). Data are presented as box and whisker plots/scatter dots with horizontal line (inside box) indicating median and outliers (n = 4 fish, white dots), and were statistically analyzed by one-way ANOVA followed by the Tukey’s multiple comparison test. Bars with different superscripts are significantly different (P < 0.05).
FIGURE 4
FIGURE 4
Immunolocalization of Ctnnb1, Gja3, Pard3, Rab5c and Tjp2 in the testis of Senegalese sole treated with saline, rFsh or rLh. The panels show representative immunofluorescence microscopy images of the localization Ctnnb1 (A–C), Gja3 (D–F), Pard3 (G–I), Rab5c (J–L) and Tjp2 (M–O) in the testis of males treated with saline (A, D, G, J, M), rFsh (B, E, H, K, N) or rLh (C, F, I, L, O) as indicated. Sections were labelled with commercial rabbit polyclonal antibodies specific for each protein and were visualized with a Cy3-conjugated sheep anti-rabbit (red) antibody. The cell nuclei were counterstained with 4′,6-diamidino-2-phenylindole (DAPI; blue), while the membranes and extracellular matrix were visualized with Alexa Fluor 647-conjugated wheat germ agglutinin (WGA, green). Scale bars, 30 µm. In each panel, the aera that was zoomed-in for the inset is indicated doted lines. The arrows in the insets point the cellular type where the expression of the protein appears to change with the treatment, i.e., Ctnnb1, Gja3 and Tjp2 (A–F) and (M–O) in Sertoli cells, and for Pard3 and Rab5c (G–L) in spermatids. Scale bars, 10 µm (in the inset, 3 µm). SPG, spermatogonia; SPC, spermatocyte; SPD, spermatid; SPZ, spermatozoa.
FIGURE 5
FIGURE 5
Gonadotropins regulate the oxytocin (Oxt) signalling pathway. (A) Heatmap of DEGs related to the Oxt signaling pathway in the rFsh- and rLh-treated groups. (B) Validation of the RNA-seq data by RT-qPCR for selected genes potentially involved in the pathway: oxytocin (oxt), oxytocin receptor a (oxtra), oxytocin receptor b (oxtrb), epidermal growth factor receptor a (egfra), adenylate cyclase 2 (adcy2), adenylate cyclase 3 (adcy3), calcium voltage-gated channel auxiliary subunit beta 1 (cacnb1), G protein subunit alpha I2 (gnai2), phospholipase C beta 3 (plcb3), protein phosphatase 3 catalytic subunit alpha (ppp3ca), and protein kinase C zeta (prkcz). Data are presented as box and whisker plots/scatter dots with horizontal line (inside box) indicating median and outliers (n = 4 fish, white dots), and were statistically analyzed by one-way ANOVA followed by the Tukey’s multiple comparison test. Bars with different superscripts are significantly different (P < 0.05). (C) Localization of oxtra (left) and oxtrb (right) transcripts in the sole testis by ISH. Paraffin sections were hybridized with antisense DIG-labeled riboprobes specific for each Oxt receptor (upper panels) as indicated. Control sections (lower panels) were hybridized with sense probes and were negative. Scale bars, 30 μm. (D) Immunolocalization of Oxt (upper panel) and Ctnnb1 (lower panel) in the testis of males exposed to different treatments using rabbit polyclonal antibodies specific for each protein (red). The nuclei were counterstained with DAPI (blue), while the membranes and extracellular matrix were visualized with WGA (green). Scale bars, 30 µm. In C and D, arrows point to Sertoli cells. Scale bars, 10 µm. SPG, spermatogonia; SPC, spermatocyte; SPD, spermatid; SPZ, spermatozoa, LC, Leydig cell.
FIGURE 6
FIGURE 6
Gonadotropic regulation of the Hippo signaling pathway. (A) Heatmap of transcripts related to the Hippo signaling pathway differentially regulated by rFsh and rLh. (B) RT-qPCR analysis of transcripts potentially involved in the pathway, such as scribble planar cell polarity protein (scrib) and snail family transcriptional repressor 2 (snai2). Data are presented as box and whisker plots/scatter dots with horizontal line (inside box) indicating median and outliers (n = 4 fish, white dots), and were statistically analyzed by one-way ANOVA followed by the Tukey’s multiple comparison test. Bars with different superscript are significantly different (P < 0.05). (C) Immunolocalization of Scrib in the testis of males exposed to different treatments (red), using a rabbit polyclonal antibody specific for SCRIB. The nuclei were counterstained with DAPI (blue), while the membranes and extracellular matrix were visualized with WGA (green). The arrows point to Sertoli cells where the staining appears to be of lower intensity with the rLh treatment. Scale bars, 30 µm. SPD, spermatid.
FIGURE 7
FIGURE 7
Gonadotropins modulate the Relaxin (Rln) signaling pathway. (A) Heatmap of transcripts related to the Rln signaling pathway differentially regulated by rFsh and rLh. (B) Validation of the RNA-seq data by RT-qPCR for selected transcripts related to the pathway: relaxin family peptide receptor 1 (rxfp1), relaxin family peptide receptor 2 (rxfp2), relaxin family peptide receptor 3 (rxfp3), cAMP responsive element binding protein 1 (creb1), relaxin 1 (rln1), relaxin 3 (rln3), insulin like 3 (insl3), and cAMP responsive element binding protein 3 like 3 (creb3l3). Data are presented as box and whisker plots/scatter dots with horizontal line (inside box) indicating median and outliers (n = 4 fish, white dots), and were statistically analyzed by one-way ANOVA followed by the Tukey’s multiple comparison test. Bars with different superscript are significantly different (P < 0.05). (C) Localization of insl3, rln1, rln3 (upper panel) and rxfp1, rxfp2 and rxfp3 (lower panel) transcripts in the sole testis by ISH with antisense (AS) DIG-labelled riboprobes specific for each transcript as indicated. Control sections hybridized with sense probes (S) were negative. Scale bars, 30 μm. (D) Immunolocalization of Creb1 in the testis of males exposed to different treatments in the cortex (left) and medullar (right) regions of the testis (red). The nuclei and membranes were counterstained with DAPI (blue) and WGA (green), respectively. Arrows indicate the nuclei of Sertoli cells. Scale bars, 30 µm. LC, Leydig cells; SPD, spermatids.
FIGURE 8
FIGURE 8
Effect of gonadotropins, Rln and Oxt, and pharmacological inhibition of their receptors, on the expression of testicular transcripts encoding CAMs in vitro. (A–F) Testicular explants were treated with 100 ng/mL rFsh, rLh Rln or Oxt, or with a combination of rFsh or rLh with Rln or Oxt, for 24 h. The negative control was only incubated with the vehicle (0.1% DMSO). Additional explants treated with vehicle, Rln or Oxt were incubated with 10 µM of Rln and Oxt receptor antagonists (AT-001 and L-371,257, respectively) for 1 h prior to stimulation with the corresponding peptide hormone. The expression of selected transcripts encoding for CAMs, indicated in each panel, was subsequently carried out by RT-qPCR. The values represent compiled data from three independent experiments using explants from different males, each with two replicates per treatment. The data are presented as box and whisker plots/scatter dots with horizontal line (inside box) indicating median and outliers (n = 4 fish, white dots), and were statistically analyzed by the two-tailed unpaired Student’s t-test, or by the nonparametric Mann Whitney test when variances were not equal. *, P < 0.05; **, P < 0.01; ***, P < 0.001, with respect to the control; +, P < 0.05; ++, P < 0.01, +++, P < 0.001, between groups as indicated by brackets.
FIGURE 9
FIGURE 9
Proposed model of the signaling pathways regulating CAMs during Senegalese sole spermiogenesis and spermiation. (A) The activation of the Fsh cognate receptor Fshr by Fsh in Leydig cells downregulates the Oxt and Rln synthesis, which induces the inhibition of the Oxt/Oxtr signaling pathway in Sertoli cells, thereby decreasing the synthesis of tight junction proteins between spermatids and Sertoli cells. Also, through Fshra activation in the Sertoli cells, Fsh directly inhibits the expression of gap junction proteins conforming the BTB (interaction between adjacent Sertoli cells). (B) Lh also reduces both Rln and Oxt synthesis in Leydig cells through the activation of the Lhcg. Thus, both Oxtr and Rxfp signaling pathways are inhibited in Sertoli cells, which impedes the proper expression of junctional proteins between Sertoli cells and between Sertoli cells and immature spermatids. (C) As a result, gonadotropins facilitate the release of spermatids from Sertoli cells and the leaking of the BTB, which allow macromolecules such as Lh to reach the lumen of the seminiferous tubule and activate the released Lhcgr-expressing mature spermatids to induce spermatozoa differentiation. The figure was drawn using Biorender (https://www.biorender.com).

Similar articles

References

    1. Abou Nader N., Charrier L., Meisnsohn M. C., Banville L., Deffrennes B., St-Jean G., et al. (2024). Lats1 and Lats2 regulate YAP and TAZ activity to control the development of mouse Sertoli cells. FASEB J. 38, e23633. 10.1096/fj.202400346R - DOI - PubMed
    1. Adams A., Wayne Vogl A. (2017). High resolution localization of Rab5, EEA1, and Nectin-3 to tubulobulbar complexes in the rat testis. Anat. Rec. 300, 1160–1170. 10.1002/ar.23563 - DOI - PubMed
    1. Assinder S. J., Rezvani A., Nicholson H. D. (2002). Oxytocin promotes spermiation and sperm transfer in the mouse. Int. J. Androl. 25, 19–27. 10.1046/j.1365-2605.2002.0318a.x - DOI - PubMed
    1. Baburski A. Z., Sokanovic S. J., Andric S. A., Kostic T. S. (2017). Aging has the opposite effect on cAMP and cGMP circadian variations in rat Leydig cells. J. Comp. Physiology. Part B 187, 613–623. 10.1007/s00360-016-1052-7 - DOI - PubMed
    1. Batlouni S. R., Nóbrega R. H., França L. R. (2009). Cell junctions in fish seminiferous epithelium. Fish Physiology Biochem. 35, 207–217. 10.1007/s10695-008-9253-y - DOI - PubMed

LinkOut - more resources