. 2025 Jun 17:8:0746.
doi: 10.34133/research.0746. eCollection 2025.

Targeting ApoE-KCC2 Signaling Rescues GABAergic Synaptic Dysfunction and Depression-like Behaviors in Mice

Affiliations

Targeting ApoE-KCC2 Signaling Rescues GABAergic Synaptic Dysfunction and Depression-like Behaviors in Mice

Chengyuan Xu et al. Research (Wash D C). .

Abstract

Apolipoprotein E (ApoE) has been implicated in neurodegenerative diseases; however, its function and underlying mechanisms in depression remain elusive. In this study, we employed chronic social defeat stress (CSDS) to establish a mouse model of depression and observed significantly reduced ApoE expression in the hippocampus. By leveraging ApoE knockout (ApoE-/- ) and knockdown (ApoE-KD) mouse models, we demonstrated that ApoE deficiency induced depression-like behaviors, which were closely associated with impaired GABAergic synaptic transmission and down-regulation of ApoE receptors and K+-Cl- cotransporter 2 (KCC2). In addition, we found an interaction between KCC2 and the ApoE receptor low-density lipoprotein receptor (LDLR) through coimmunoprecipitation analysis. Moreover, overexpression of ApoE or targeted activation of GABAergic neurons in the hippocampus significantly reversed depression-like behaviors in both CSDS-exposed and ApoE-KD mice. Lastly, treatment with KCC2 activators, CLP290 and CLP257, restored the expression levels of KCC2 and the GABAAR α1 subunit, significantly alleviating depression-like behaviors induced by CSDS or ApoE-KD. Together, our results elucidate the pivotal role of ApoE in the pathophysiology of depression and highlight the ApoE-KCC2 signaling pathway as a potential target for developing innovative antidepressant therapies.


Conflict of interest statement

Competing interests: The authors declare that they have no competing interests.

Figures

Fig. 1.
Fig. 1.
Decreased expression levels of glial fibrillary acidic protein (GFAP) and apolipoprotein E (ApoE) in the hippocampus of susceptible (Sus) group mice after chronic social defeat stress (CSDS) exposure. (A) Experiment flowchart and timeline for habituation, CSDS, and behavioral tests (social interaction test [SIT], tail suspension test [TST], forced swimming test [FST], and sucrose preference test [SPT]). (B) Representative tracks from the SIT (the blue area is marked as the social interaction [SI] zone) and a pie chart showing the proportion of Sus (social interaction ratio [SIR] < 1) and resilient (Res) (SIR > 1) mice (Sus, n = 13; Res, n = 4). Statistical results of SIR (control [Ctrl], n = 12; Sus, n = 13; Res, n = 4). (C) Statistical results of immobility time in the TST and FST (Ctrl, n = 12; Sus, n = 13). Statistical results of the SPT showing the sucrose preference rate (Ctrl, n = 13; Sus, n = 13). (D) Representative western blot bands for GFAP and ApoE in the hippocampus, with statistical results for GFAP and ApoE protein (Ctrl, n = 3; Sus, n = 3) and messenger RNA (mRNA) levels (Ctrl, n = 5; Sus, n = 5). (E) Representative western blot bands for GFAP and ApoE in the hippocampus, with statistical results for GFAP and ApoE protein (Ctrl, n = 3; Res, n = 3) and mRNA levels (Ctrl, n = 5; Res, n = 5). Values are presented as mean ± standard error of the mean (SEM). *P < 0.05; **P < 0.01; ***P < 0.001.
Fig. 2.
Fig. 2.
Overexpression of ApoE in the hippocampus alleviates depression-like behaviors induced by CSDS exposure. (A) Experiment flowchart and timeline for habituation, adeno-associated virus (AAV) injection, CSDS, and behavioral tests (SIT, open-field test [OFT], TST, and FST). (B) Expression of rAAV-EF1α-ApoE-P2A-EGFP-WPRE-hGH polyA in the hippocampus. Scale bar = 200 μm; enlarged image scale bar = 100 μm. Confirmation of ApoE protein and mRNA expression validates the overexpression efficacy of AAV-ApoE-OE (Ctrl-AAV, n = 3; ApoE-OE, n = 3). (C) Representative tracks from the SIT (the blue area is marked as the SI zone) and statistical results of the SIR (Ctrl & Ctrl-AAV, n = 8; Sus & Ctrl-AAV, n = 7; Sus & ApoE-OE, n = 8). (D) Statistical results of immobility time in the TST and FST (Ctrl & Ctrl-AAV, n = 8; Sus & Ctrl-AAV, n = 7; Sus & ApoE-OE, n = 8). (E) Representative tracks from the OFT (the yellow area is marked as the central zone) and statistical results of the distance moved, line crossings, speed, entries to the centers, and time/distance spent in the center during the OFT (Ctrl & Ctrl-AAV, n = 8; Sus & Ctrl-AAV, n = 7; Sus & ApoE-OE, n = 8). Values are presented as mean ± SEM. Ctrl & Ctrl-AAV vs. Sus & Ctrl-AAV, *P < 0.05, **P < 0.01, ***P < 0.001; Sus & Ctrl-AAV vs. Sus & ApoE-OE, #P < 0.05, ##P < 0.01.
Fig. 3.
Fig. 3.
Hippocampal ApoE knockdown induces depression-like behaviors in mice. (A) Experiment flowchart and timeline for habituation, AAV injection, and behavioral tests (OFT, TST, FST, and SPT). (B) Expression of AAV-ApoE-KD in the hippocampus. Scale bar = 200 μm; enlarged image scale bar = 100 μm. (C) Confirmation of ApoE protein expression validates the knockdown efficacy of AAV-ApoE-KD (Ctrl-shRNA, n = 3; ApoE-KD, n = 3). (D) Confirmation of ApoE mRNA expression validates the knockdown efficacy of AAV-ApoE-KD (Ctrl-shRNA, n = 5; ApoE-KD, n = 5). (E) Statistical results of immobility time in the TST (Ctrl-shRNA, n = 22; ApoE-KD, n = 23) and FST (Ctrl-shRNA, n = 29; ApoE-KD, n = 30). Statistical results of the SPT showing sucrose preference rate (Ctrl-shRNA, n = 9; ApoE-KD, n = 9). (F) Representative tracks from the OFT (the yellow area is marked as the central zone). Statistical results of the distance moved, line crossings, speed, entries to the centers, and time/distance spent in the center during the OFT (Ctrl-shRNA, n = 10; ApoE-KD, n = 10). Values are presented as mean ± SEM. *P < 0.05; **P < 0.01; ***P < 0.001; ****P < 0.0001. ApoE-KD, ApoE knockdown; shRNA, short hairpin RNA.
Fig. 4.
Fig. 4.
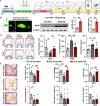
Hippocampal ApoE knockdown leads to synaptic dysfunction in mice. (A) Down-regulated genes after mouse hippocampal ApoE knockdown (Gene Ontology terms). (B) Results of gene set enrichment analysis (GSEA) for the transcripts in the trend analysis. (C) Regulation of the postsynaptic membrane potential heatmap of the analyzed GeneSet. (D) Representative traces of miniature excitatory postsynaptic current (mEPSC) and miniature inhibitory postsynaptic current (mIPSC) from the hippocampus. (E) Statistical results of mEPSC frequency (Ctrl-shRNA, n = 11 neurons from 3 mice; ApoE-KD, n = 10 neurons from 3 mice), mEPSC amplitude (Ctrl-shRNA, n = 10 neurons from 3 mice; ApoE-KD, n = 9 neurons from 3 mice), mIPSC frequency (Ctrl-shRNA, n = 17 neurons from 3 mice; ApoE-KD, n = 22 neurons from 3 mice), and mIPSC amplitude (Ctrl-shRNA, n = 16 neurons from 3 mice; ApoE-KD, n = 22 neurons from 3 mice). (F) Representative western blot bands for GABAAR α1, K+–Cl cotransporter 2 (KCC2), GluR2, NMDAR2B, PSD95, low-density lipoprotein receptor (LDLR), and LDLR-related protein 1 (LRP1) in the hippocampus, with statistical results for these proteins (Ctrl-shRNA, n = 3; ApoE-KD, n = 3). (G) Statistical results of KCC2 mRNA levels in the hippocampus (Ctrl-shRNA, n = 10; ApoE-KD, n = 10). (H) Enzyme-linked immunosorbent assay (ELISA) statistical results for γ-aminobutyric acid (GABA) and glutamate (Glu) levels in the hippocampus (Ctrl-shRNA, n = 8; ApoE-KD, n = 8). Values are presented as mean ± SEM. *P < 0.05; **P < 0.01; ***P < 0.001. NES, normalized enrichment score; FDR, false discovery rate.
Fig. 5.
Fig. 5.
KCC2 interacts with ApoE receptors. (A) Three-dimensional structure of KCC2 and LDLR, 3-dimensional structure of KCC2 and LDLR docking, and molecular docking results of KCC2 and LDLR. (B) Coimmunoprecipitation (Co-IP) analysis showing the interaction between KCC2 and LDLR, as well as KCC2 and LRP1 in hippocampal lysates. (C) Representative fluorescence images of KCC2 and LDLR colocalization in HT22 cells. Scale bar = 20 μm; enlarged image scale bar = 5 μm. RMSD, root mean square deviation; DAPI, 4′,6-diamidino-2-phenylindole.
Fig. 6.
Fig. 6.
Decreased ApoE receptors, KCC2, and GABAAR α1 protein levels in the hippocampus of ApoE−/− mice. (A) The supernatant obtained from ApoE−/− mouse hippocampal tissue was collected for subsequent experimental analyses. (B) Representative western blot bands for ApoE and KCC2. Statistical results of these proteins (wild type [WT], n = 3; ApoE−/−, n = 3). (C) Primary hippocampal neurons isolated from ApoE−/− mouse pup brain. (D) Representative western blot bands for ApoE, KCC2, GABAAR α1, LDLR, and LRP1. Statistical results of these proteins (WT, n = 3; ApoE−/−, n = 3). (E) Primary hippocampal neurons isolated from ApoE−/− mouse pup brain treated with CLP257. (F) Representative western blot bands for KCC2 and GABAAR α1. Statistical results of these proteins (WT, n = 3; ApoE−/−, n = 3; ApoE−/− & CLP257, n = 3). (G) Treatment with ApoE recombinant protein in HT22 cells. (H) Representative western blot bands for ApoE, KCC2, GABAAR α1, LDLR, and LRP1. Statistical results of these proteins (vehicle, n = 3; ApoE, n = 3). Values are presented as mean ± SEM. WT vs. ApoE−/−, *P < 0.05, ***P < 0.001, ****P < 0.0001; ApoE−/− vs. ApoE−/− & CLP257, #P < 0.05, ##P < 0.01; vehicle vs. ApoE, *P < 0.05, **P < 0.01. HIP, hippocampus.
Fig. 7.
Fig. 7.
Targeted activation of hippocampal GABAergic neurons reverses depression-like behaviors in mice following CSDS exposure. (A) Experiment flowchart and timeline for habituation, AAV injection, CSDS, clozapine N-oxide (CNO) intraperitoneal injection, and behavioral tests (SIT, OFT, TST, and FST). (B) Activation of Vgat1-hM3DGq in hippocampal GABAergic neurons significantly increases c-Fos expression. Scale bar = 100 μm. (C) Representative tracks from the SIT (the blue area is marked as the SI zone). Statistical results of SIR (Ctrl, n = 9; Sus & AAV-Vgat1-hM3DGq & vehicle, n = 8; Sus & AAV-Vgat1-hM3DGq & CNO, n = 8). (D) Statistical results of immobility time in the TST and FST (Ctrl, n = 9; Sus & AAV-Vgat1-hM3DGq & vehicle, n = 8; Sus & AAV-Vgat1-hM3DGq & CNO, n = 8). (E) Representative tracks from the OFT (the yellow area is marked as the central zone). Statistical results of the distance moved, line crossings, speed, entries to the centers, and time/distance spent in the center during the OFT (Ctrl, n = 9; Sus & AAV-Vgat1-hM3DGq & vehicle, n = 8; Sus & AAV-Vgat1-hM3DGq & CNO, n = 8). Values are presented as mean ± SEM. Ctrl vs. Sus & AAV-Vgat1-hM3DGq & vehicle, *P < 0.05, **P < 0.01, ***P < 0.001; Sus & AAV-Vgat1-hM3DGq & vehicle vs. Sus & AAV-Vgat1-hM3DGq & CNO, #P < 0.05, ##P < 0.01.
Fig. 8.
Fig. 8.
Targeted activation of hippocampal GABAergic neurons partially reverses depression-like behaviors in ApoE-KD mice. (A) Experiment flowchart and timeline for habituation, AAV injection, CNO intraperitoneal injection, and behavioral tests (OFT, TST, and FST). (B) AAV-Vgat1-hM3DGq specifically labels GABAergic neurons in the hippocampus. Scale bar = 20 μm. (C) The protein expression of ApoE confirmed the knockdown effect of AAV-ApoE-KD (Ctrl-shRNA, n = 3; ApoE-KD/Vgat1-hM3DGq & vehicle, n = 3; ApoE-KD/Vgat1-hM3DGq & CNO, n = 3). (D) Statistical results of immobility time in the TST and FST (Ctrl-shRNA, n = 9; ApoE-KD/Vgat1-hM3DGq & vehicle, n = 8; ApoE-KD/Vgat1-hM3DGq & CNO, n = 8). (E) Representative tracks from the OFT (the yellow area is marked as the central zone). Statistical results of the distance moved, line crossings, speed, entries to the centers, and time/distance spent in the center during the OFT (Ctrl-shRNA, n = 9; ApoE-KD/Vgat1-hM3DGq & vehicle, n = 8; ApoE-KD/Vgat1-hM3DGq & CNO, n = 8). Values are presented as mean ± SEM. Ctrl-shRNA vs. ApoE-KD/Vgat1-hM3DGq & vehicle, *P < 0.05, **P < 0.01, ***P < 0.001; ApoE-KD/Vgat1-hM3DGq & vehicle vs. ApoE-KD/Vgat1-hM3DGq & CNO, #P < 0.05, ##P < 0.01.
Fig. 9.
Fig. 9.
CLP290 reverses depression-like behaviors induced by CSDS exposure. (A) Experiment flowchart and timeline for habituation, CSDS, CLP290 intraperitoneal injection, and behavioral tests (SIT, OFT, TST, and FST). (B) Representative tracks from the SIT (the blue area is marked as the SI zone). Statistical results of SIR (Ctrl & HPCD, n = 10; Sus & HPCD, n = 8; Sus & CLP290, n = 10). (C) Statistical results of immobility time in the TST and FST (Ctrl & HPCD, n = 10; Sus & HPCD, n = 8; Sus & CLP290, n = 10). (D) Representative tracks from the OFT (the yellow area is marked as the central zone). Statistical results of the distance moved, line crossings, speed, entries to the centers, and time/distance spent in the center during the OFT (Ctrl & HPCD, n = 10; Sus & HPCD, n = 8; Sus & CLP290, n = 10). (E) Representative western blot bands for KCC2 and GABAAR α1 in the hippocampus. Statistical results of KCC2 and GABAAR α1 protein levels in the hippocampus (Ctrl & HPCD, n = 3; Sus & HPCD, n = 3; Sus & CLP290, n = 3). Values are presented as mean ± SEM. Ctrl & HPCD vs. Sus & HPCD, *P < 0.05, **P < 0.01, ***P < 0.001; Sus & HPCD vs. Sus & CLP290, #P < 0.05, ##P < 0.01. HPCD, hydroxypropyl-β-cyclodextrin.
Fig. 10.
Fig. 10.
CLP290 improves depression-like behaviors induced by ApoE-KD. (A) Experiment flowchart and timeline for habituation, AAV injection, CLP290 intraperitoneal injection, and behavioral tests (OFT, TST, and FST). (B) Representative western blot bands for KCC2 and GABAAR α1 in the hippocampus. Statistical results of KCC2 and GABAAR α1 protein levels in the hippocampus (Ctrl-shRNA & HPCD, n = 3; ApoE-KD & HPCD, n = 3; ApoE-KD & CLP290, n = 3). (C) Statistical results of immobility time in the TST and FST (Ctrl-shRNA & HPCD, n = 10; ApoE-KD & HPCD, n = 10; ApoE-KD & CLP290, n = 10). (D) Representative tracks from the OFT (the yellow area is marked as the central zone). Statistical results of the distance moved, line crossings, speed, entries to the centers, and time/distance spent in the center during the OFT (Ctrl-shRNA & HPCD, n = 10; ApoE-KD & HPCD, n = 10; ApoE-KD & CLP290, n = 10). Values are presented as mean ± SEM. Ctrl-shRNA & HPCD vs. ApoE-KD & HPCD, *P <0.05, **P <0.01, ***P <0.001; ApoE-KD & HPCD vs. ApoE-KD & CLP290, #P < 0.05, ##P < 0.01.
Fig. 11.
Fig. 11.
A working model illustrating the mechanism by which ApoE regulates GABAAR-mediated inhibition and depression-like behaviors in mice. ApoE deficiency leads to reduced activity of the ApoE receptors’ pathway on neurons, which promotes KCC2 degradation. This results in decreased protein levels of KCC2 and GABAAR α1, weakening GABAergic inhibition in neurons and ultimately inducing depression-like behaviors in mice.

References

    1. Herrman H, Patel V, Kieling C, Berk M, Buchweitz C, Cuijpers P, Furukawa TA, Kessler RC, Kohrt BA, Maj M, et al. Time for united action on depression: A Lancet–World Psychiatric Association Commission. Lancet. 2022;399(10328):957–1022. - PubMed
    1. Zhang QY, Su CW, Luo Q, Grebogi C, Huang ZG, Jiang J. Adaptive whole-brain dynamics predictive method: Relevancy to mental disorders. Research. 2025;8:0648. - PMC - PubMed
    1. Zhu B, Gu Z, Hu H, Huang J, Zeng Z, Liang H, Yuan Z, Huang S, Qiu Y, Sun XD, et al. Altered gut microbiota contributes to acute-respiratory-distress-syndrome-related depression through microglial neuroinflammation. Research. 2025;8:0636. - PMC - PubMed
    1. Gong Q, He Y. Depression, neuroimaging and connectomics: A selective overview. Biol Psychiatry. 2015;77(3):223–235. - PubMed
    1. Marwaha S, Palmer E, Suppes T, Cons E, Young AH, Upthegrove R. Novel and emerging treatments for major depression. Lancet. 2023;401(10371):141–153. - PubMed

LinkOut - more resources