. 2025 May 22;28(6):112731.
doi: 10.1016/j.isci.2025.112731. eCollection 2025 Jun 20.

Aurora B and INCENP co-overexpression severely disrupts mitosis and distinctly modifies the global transcriptional landscape

Affiliations

Aurora B and INCENP co-overexpression severely disrupts mitosis and distinctly modifies the global transcriptional landscape

María Galindo-Moreno et al. iScience. .

Abstract

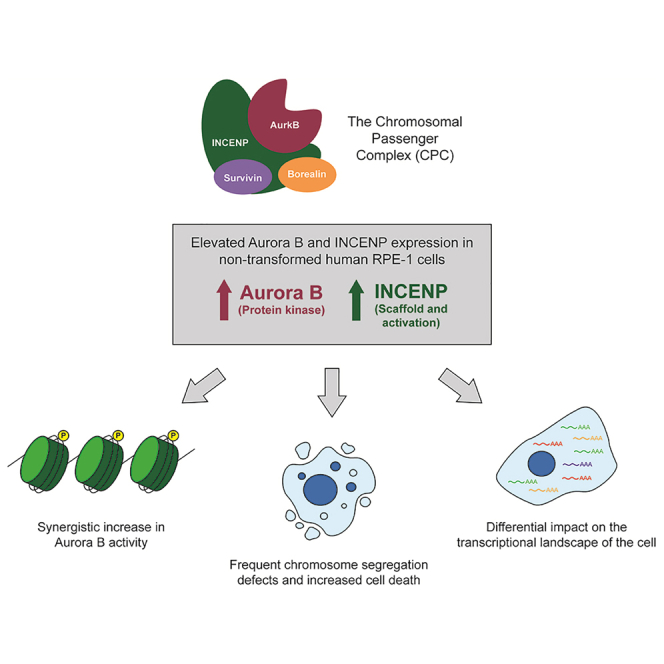
Aurora B kinase, as part of the chromosomal passenger complex (CPC), controls key processes during the cell cycle such as DNA compaction, genome partitioning, or cytokinesis. Nonetheless, increased Aurora B levels are a potential threat for the cells and have been linked to different tumor types. We have carried out an exhaustive characterization of the global consequences of the overexpression of Aurora B and INCENP, the scaffold of the CPC and an activator of Aurora B kinase activity, in non-transformed human cells. Our data demonstrate not only that an individual increase in the levels of Aurora B or INCENP have a different impact on the cells, but more importantly that their simultaneous overexpression stabilizes both CPC components, exacerbates Aurora B activity, severely impairs mitotic progression and chromosome dynamics, and has a distinctive and more dramatic effect on the transcriptional landscape of the cells.

Keywords: Cell biology; Transcriptomics.


Conflict of interest statement

The authors declare no competing interests.

Figures

None
Graphical abstract
Figure 1
Figure 1
Concurrent overexpression of AurkB and INCENP promotes a synergistic increase in Aurora B kinase activity (A and B) Human RPE-1 cells were transduced with lentiviruses carrying vectors for overexpression of AurkB, INCENP or both proteins (AurkB+INCENP). Western blots show intracellular levels of AurkB and INCENP protein 72 h post-lentiviral infection (A) and in cells that, after transduction, were cultured for an extended period and then FACS-sorted to isolate stable cell lines (B). Total H3 and H3S10P amounts are displayed as an indicator of AurkB activity. Actin levels were used as a loading control. (C–G) RPE-1 cells carrying an extra copy of AURKB (AurkB), INCENP (INCENP) or a bicistronic construct that comprises both genes linked by a sequence encoding a P2A “self-cleaving” oligopeptide (AurkB+INCENP), all under the control of the TET promoter, were alternatively used to conditionally overexpress AurkB and/or INCENP. (C) Western blot shows total AurkB, INCENP, H3, H3S10P and actin protein levels 32 h after addition of 2 μg/mL tetracycline. (D–G) Immunofluorescence pictures showing AurkB (D–F) or Survivin (G) (both in green), as well as INCENP (in red) localization. DAPI (in blue) and merged images are also provided. Scale bars, 10 μm. (D-F) AurkB and INCENP distribution was evaluated at different cell cycle stages from pro-metaphase to telophase in control cells (D) and in cells that overexpressed AurkB and INCENP at moderately low (overexpression) (E) or at high levels (high overexpression) (F). In the latter case, Survivin localization was also analyzed (G).
Figure 2
Figure 2
Elevated levels of AurkB and INCENP expression elicit a prolonged cell cycle delay and increased cell death (A–G) Analysis of cell cycle progression in RPE-1 cells carrying an extra copy of AURKB (AurkB), INCENP (INCENP) or a bicistronic construct that comprises both genes linked by a sequence encoding a P2A “self-cleaving” oligopeptide (AurkB+INCENP, A + I), all under control of the TET promoter. (A-B) Percentage of G1, S phase and G2/M cells in the population, as estimated by flow cytometry analyses, before (Not induced) (A) or 32 h after (Induced) (B) addition of 2 μg/mL tetracycline (Tet). Data are the average of 3 experiments (n = 3). Error bars represent SEM. Statistically significant differences according to a one-way ANOVA test are indicated (∗∗∗, p < 0.001; ∗∗, p < 0.01; ∗, p < 0.05; n.s., not significant). (C-D) Mitotic length was evaluated by following the distribution of a mEmerald-tagged version of Cyclin B1 (CycB) in individual cells using fluorescence microscopy. (C) Selected images from representative live-cell fluorescence microscopy experiments. Pictures display mEmerald-Cyclin B1 (CycB, in green) and DNA (SiR-DNA, in pink), as well as merged and bright-field (BF) images, at the indicated times, both in a control cell and in a cell overexpressing Aurora B and INCENP. Full time courses of the experiments depicted in (C) are shown in Videos S1 and S2. Scale bars, 10 μm. (D) Graph shows the time from CycB translocation into the nucleus at mitotic onset (t = 0 min) to its destruction at the metaphase-to-anaphase transition in control cells and in cells overexpressing Aurora B and/or INCENP. The experiment was repeated thrice (n = 3), with similar results; a representative experiment is shown. Mean values and error bars (SEM) are designated with red lines. Statistically significant differences according to a one-way ANOVA test are indicated (∗∗∗, p < 0.001; ∗∗, p < 0.01; ∗, p < 0.05; n.s., not significant). (E-F) Cell cycle progression was also evaluated in live cells using light microscopy. Overexpressed AurkB and/or INCENP proteins were tagged with mTurquoise2 and only cells that displayed high overexpression levels were taken into account for this experiment. (E) Selected images of a control cell and of cells overexpressing Aurora B and/or INCENP, at the indicated time points, in representative light microscopy experiments. The white arrow denotes metaphase plate establishment. Full time courses of the experiments depicted in (E) are shown in Videos S3, S4, S5 and S6. Scale bars, 10 μm. (F) The graph shows time from initial establishment of the metaphase plate (t = 0 min) to mitotic exit onset in control cells and in cells overexpressing Aurora B and/or INCENP. For each individual cell, it is further indicated whether the cell cycle took longer than full extension of the experiment (light gray dots) and if the cells eventually divided (dark gray dots) or ended up dying (black dots). The experiment was repeated thrice (n = 3), with similar results; a representative experiment is shown. Mean values and error bars (SEM) are designated with red lines. Statistically significant differences according to a one-way ANOVA test are indicated (∗∗∗, p < 0.001; ∗∗, p < 0.01; ∗, p < 0.05; n.s., not significant). (G) Increase in the sub-G1 population in cultures of cells that overexpressed AurkB (light gray bars), INCENP (dark gray bars) or the two CPC components (A + I, black bars), as compared to control RPE-1 cells (Control, white bars), 32 h after 2 μg/mL tetracycline addition (Induced, +Tet). Relative increases to the control in uninduced cell cultures (Not induced, -Tet) are also shown. Data are the average of 3 experiments (n = 3). Error bars represent SEM. Statistically significant differences according to a one-way ANOVA test are indicated (∗∗∗, p < 0.001; ∗∗, p < 0.01; ∗, p < 0.05; n.s., not significant).
Figure 3
Figure 3
Overexpression of AurkB and INCENP leads to chromosome segregation defects and a persistent activation of the spindle assembly checkpoint (A–G) RPE-1 cells carrying an extra copy of AURKB (AurkB), INCENP (INCENP) or a bicistronic construct that comprises both genes linked by a sequence encoding a P2A “self-cleaving” oligopeptide (AurkB+INCENP), all under the control of the TET promoter, were treated with 2 μg/mL tetracycline to induce AurkB and/or INCENP overexpression. (A) Percentages of mitotic cells in the culture displaying abnormal nuclear and spindle morphologies (aberrant mitosis) 32 h after tetracycline addition. Data are the average of 3 experiments (n = 3). Error bars represent SEM. Statistically significant differences according to a one-way ANOVA test are indicated (∗∗∗, p < 0.001; ∗∗, p < 0.01; ∗, p < 0.05; n.s., not significant). (B) Representative immunofluorescence images of tubulin (in green) and DNA (DAPI, in blue) in normal and aberrant mitoses. Scale bars, 10 μm. (C) Percentages of interphase cells showing nuclear aberrations in each cell line. Data are the average of 3 experiments (n = 3). Error bars represent SEM. Statistically significant differences according to a one-way ANOVA test are indicated (∗∗∗, p < 0.001; ∗∗, p < 0.01; ∗, p < 0.05; n.s., not significant). (D) Representative immunofluorescence images showing tubulin (in green) and DNA (DAPI, in blue) in a normal cell and a cell displaying nuclear aberrations in interphase. Scale bars, 10 μm. (E) Western blot analysis of total Mad2 protein levels in the different RPE-1 cell lines 32 h after addition of tetracycline. Actin was used as a loading control. (F-G) Localization of Mad2-Ruby (in red) in RPE-1 cells also expressing the kinetochore marker Mis12 tagged with iRP670 (in blue). Selected images from representative live-cell fluorescence microscopy experiments are shown both in control cells (F) and in cells overexpressing AurkB and INCENP (G). A picture displaying the overlap between Mad2-Ruby and Mis12-iRP670 (overlap), as well as a merged image (merged), are also included to facilitate evaluation of Mad2 localization to kinetochores. Images were acquired at different times after initial Mad2 loading on kinetochores (t = 0 min). Scale bars, 10 μm. Full time courses of the experiments depicted in (F) and (G) are shown, respectively, in Videos S7 and S8.
Figure 4
Figure 4
H3S10P is enriched genome-wide after the concurrent increase in AurkB and INCENP protein levels (A–F) RPE-1 cells carrying an extra copy of AURKB (AurkB), INCENP (INCENP) or a bicistronic construct that comprises both genes linked by a sequence encoding a P2A “self-cleaving” oligopeptide (AurkB+INCENP, A + I), all under the control of the TET promoter, were used to evaluate H3S10P distribution 32 h after addition of 2 μg/mL tetracycline. (A) Immunofluorescence images display the sub-cellular distribution of H3S10P (in green) in selected cells, both during interphase and in metaphase. DAPI (in blue) and a merged image (Merged) are also included. Scale bars, 10 μm. (B) Graph shows the percentages of interphase cells presenting (+) or not (−) positive H3S10P signal, both in interphase (Inter) and in metaphase (Meta). Overexpressed AurkB and/or INCENP proteins were tagged with mTurquoise2 to discriminate between cells that displayed high (black bars) or low/intermediate (white bars) levels of overexpression. Data are the average of 3 experiments (n = 3). Error bars represent SD. (C–F) ChIP-seq analyses of H3S10P genome-wide distribution in cells overexpressing Aurora B, INCENP or both CPC components, as well as in control cells. (C) H3S10P enrichment in reference-adjusted reads per million (RRPM) across the whole length of chromosome 2, both before (INPUT) and after immunoprecipitation using a specific H3S10P antibody (IP). To facilitate comparison, data for cells overexpressing both AurkB and INCENP are shown in black, and in gray for all other cell lines. Black bars on top display peak calling analysis for control cells. The H3S10P distribution map was elaborated using UCSC Genome Browser (http://genome.ucsc.edu). (D) Relative H3S10P enrichment in all chromosomes. The graph shows, for H3S10P immunoprecipitations in every cell line, the fold increase in the median RRPM value estimated for each chromosome relative to that obtained in control cells. (E-F) Average profiles (E) and heatmaps (F) displaying H3S10P ChIP-seq signal for all cell lines in a 4 kb window centered in the middle of the peaks identified in control cells.
Figure 5
Figure 5
The transcriptional landscape of the cells is differentially modified by overexpression of AurkB and/or INCENP (A–G) RNA-seq analyses in RPE-1 cells carrying an extra copy of AURKB (AurkB), INCENP (INCENP) or a bicistronic construct that comprises both genes linked by a sequence encoding a P2A “self-cleaving” oligopeptide (Both), all under the control of the TET promoter, as well as in control cells (Control). Gene expression was evaluated 32 h after treatment with 2 μg/mL tetracycline to induce AurkB and/or INCENP overexpression. (A-C) Venn diagrams summarizing the number of differentially expressed (DE) genes (abs(FC) > 1.5; adj p value < 0.05) identified in each cell line, as compared to control cells. Percentages relative to the total number of DE genes are also indicated in parentheses below. Besides a Venn diagram including all DE genes (A), others considering only up-regulated (FC > 1.5; adj p value < 0.05) (B) or down-regulated (FC < 1.5; adj p value < 0.05) (C) DE genes are also shown. (D-F) Heatmaps to compare transcriptional changes in control cells (Control) and in cells overexpressing AurkB (D), INCENP (E) or both proteins (F). The Z score, computed using normalized counts from RNA-seq, was used as a measure of gene expression. Z score ranges from −3 to +3 standard deviations, and a color legend graded from blue (most negative values) to red (most positive values) is provided to assess gene expression changes. Only DE genes are included in the comparison. Genes are grouped in the Y axis according to the similarity between expression patterns, which is represented by a dendrogram. The X axis shows the different samples analyzed (two repeats for each cell line), grouped in a dendrogram by similarity between their gene expression patterns. (G) Transcriptional map displaying total estimated reads per kilobase per million (RPKM) along the indicated region from chromosome 13. Data from two separate experiments (#1 and #2) are included for each cell line. RPKM values are displayed for sequences in both the forward (fwd) and reverse (rvs) DNA strands. To facilitate comparison, data are shown in black for cells overexpressing AurkB and INCENP (Both), and in gray for the rest. Green and red boxes highlight, respectively, an example of a specific locus whose expression is unaffected by increased levels of AurkB and/or INCENP (ITM2B) and a gene that is upregulated only when both CPC components are overexpressed (LPAR6). Position of cis-regulatory elements (cCREs) is also indicated. Maps were elaborated using UCSC Genome Browser (http://genome.ucsc.edu). (H–J) RNA-seq and ChIP-seq data comparison. (H) Boxplots show average H3S10P signal (ChIP-seq) for DE genes (RNA-seq) in control cells (C) and cells overexpressing AurkB (A), INCENP (I) or both proteins (A + I). H3S10P enrichment was separately estimated for up- (gray bars) and down-regulated (white bars) genes. (I) Average profiles of H3S10P ChIP-seq signal in control cells for genes up- (light blue) or down-regulated (dark blue) due to concurrent AurkB and INCENP overexpression, as well as for non-altered genes (yellow). A region covering 1 kb before the transcription start site (TSS) to 1 kb after the transcription end site (TES) is displayed. Genes were scaled to 1 kb to correct for length differences. (J) Boxplots show average H3S10P ChIP-seq signal in control cells at the promoters of non-altered genes and genes up- or down-regulated due to AurkB and INCENP overexpression. (H, J) Median RFPKM or RRPM average values for H3S10P signal are indicated with a red line. Error bars range, respectively, between the maximum and 3rd quartile values, and the minimum and 1st quartile values. Statistically significant differences according to a Wilcoxon test are indicated (∗∗∗, p < 0.0005; ∗∗, p < 0.005; ∗, p < 0.05; n.s., not significant).
Figure 6
Figure 6
Gene ontology analysis of differentially expressed genes after the overexpression of AurkB and/or INCENP (A–C) Gene ontology (GO) enrichment analysis of DE genes identified by RNA-seq in RPE-1 cells carrying an extra copy of AURKB (A), INCENP (B), or a bicistronic construct that comprises both genes linked by a sequence encoding a P2A “self-cleaving” oligopeptide (C), all under the control of the TET promoter, 32 h after addition of 2 μg/mL tetracycline to induce AurkB and/or INCENP overexpression. For each GO category specified, the graphs represent the percentage of DE genes (abs(FC) > 1.5; adj p value < 0.05) that were identified, as compared to control cells, relative to the total number of genes in that particular category. GO analyses were performed using the DAVID bioinformatic platform (https://david.ncifcrf.gov/). Only GO categories that incorporated the most DE genes are represented for each cell line. GO categories specifically enriched in DE genes that were identified after AurkB (gray bars) or INCENP (white dotted bars) overexpression, whether or not the other CPC component was also induced, are indicated. Similarly, GO categories enriched in DE genes found after tetracycline addition in all cell lines (black bars) are also highlighted. Statistically significant enrichments according to a Bonferroni test are indicated (∗∗∗, p < 0.001; ∗∗, p < 0.01; ∗, p < 0.05; n.s., not significant).

Similar articles

References

    1. Krenn V., Musacchio A. The Aurora B Kinase in Chromosome Bi-Orientation and Spindle Checkpoint Signaling. Front. Oncol. 2015;5:225. doi: 10.3389/fonc.2015.00225. - DOI - PMC - PubMed
    1. Carmena M., Wheelock M., Funabiki H., Earnshaw W.C. The chromosomal passenger complex (CPC): from easy rider to the godfather of mitosis. Nat. Rev. Mol. Cell Biol. 2012;13:789–803. doi: 10.1038/nrm3474. - DOI - PMC - PubMed
    1. Kitagawa M., Lee S.H. The chromosomal passenger complex (CPC) as a key orchestrator of orderly mitotic exit and cytokinesis. Front. Cell Dev. Biol. 2015;3:14. doi: 10.3389/fcell.2015.00014. - DOI - PMC - PubMed
    1. van der Horst A., Lens S.M.A. Cell division: control of the chromosomal passenger complex in time and space. Chromosoma (Berl.) 2014;123:25–42. doi: 10.1007/s00412-013-0437-6. - DOI - PMC - PubMed
    1. Hindriksen S., Lens S.M.A., Hadders M.A. The Ins and Outs of Aurora B Inner Centromere Localization. Front. Cell Dev. Biol. 2017;5:112. doi: 10.3389/fcell.2017.00112. - DOI - PMC - PubMed

LinkOut - more resources