. 2025 Sep 4;15(9):1819-1834.
doi: 10.1158/2159-8290.CD-24-1208.

Cytotoxic NK Cells Impede Response to Checkpoint Immunotherapy in Melanoma with an Immune-Excluded Phenotype

Affiliations

Cytotoxic NK Cells Impede Response to Checkpoint Immunotherapy in Melanoma with an Immune-Excluded Phenotype

Joanna Pozniak et al. Cancer Discov. .

Abstract

Immune checkpoint blockade (ICB) has revolutionized cancer treatment. Unfortunately, the inability of lymphocytes to infiltrate the tumor nest, a phenomenon known as immune exclusion, drastically limits ICB responsiveness. Analyzing the immune landscape of matched pre- and early on-treatment biopsies of patients with melanoma undergoing ICB therapy, we observed a significant increase in cytotoxic NK cells in early on-treatment biopsies from nonresponders. Spatial multiomic analyses revealed that, although NK cells colocalized with CD8+ T cells within the tumor bed in responding lesions, they were excluded from the tumor parenchyma in nonresponding lesions. Strikingly, pharmacologic depletion of NK cells in a unique melanoma mouse model exhibiting an immune-excluded phenotype unleashed immune infiltration of the tumor core and tumor clearance upon ICB exposure. Mechanistically, we show that NK cells are actively recruited to immune-excluded areas upon ICB exposure via the chemokine receptor CX3CR1 to suppress tumor infiltration and antitumor function of CD8+ T cells.

Significance: Immune exclusion is responsible for intrinsic resistance to ICB in about half of nonresponder patients. Our unexpected observation that targeting NK cell biology unleashes the recruitment and antitumor activity of CD8+ T cells in tumors with an immune-excluded phenotype offers a potential therapeutic avenue for this large patient population. See related commentary by Galvez-Cancino et al., p. 1777 See related article by Song et al., p. 1835.


Conflict of interest statement

J. Pozniak reports personal fees from Stichting Tegen Kanker and H2020-MSCA-IF-2019 during the conduct of the study. N. Roda reports personal fees from Fonds Wetenschappelijk Onderzoek during the conduct of the study. A. De Visscher reports grants from Fonds Wetenschappelijk Onderzoek Vlaanderen during the conduct of the study. P.G. Demaerel reports personal fees from Fonds Wetenschappelijk Onderzoek during the conduct of the study. J. Declercq reports grants from Fonds Wetenschappelijk Onderzoek, VIB vzw, Stichting Tegen Kanker, and iBOF during the conduct of the study. C. Gkemisis reports personal fees from Fonds Wetenschappelijk Onderzoek during the conduct of the study. L. Pollaris reports grants from Fonds Wetenschappelijk Onderzoek Vlaanderen during the conduct of the study. F.M. Bosisio reports grants from Fonds Wetenschappelijk Onderzoek Fundamenteel Klinisch Mandaat EMH-D8972-FKM/20 during the conduct of the study. Z. Li reports personal fees from HanchorBio and Henlius and other support from Alphamab Oncology outside the submitted work. No disclosures were reported by the other authors.

Figures
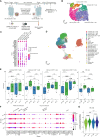
Figure 1.
Figure 1.
Dissecting the immune compartment of the melanoma ecosystem under immunotherapy pressure. A, Schematic describing the design of the SPECIAL clinical study, the timing of sample collection, number of patients enrolled, and samples collected, and single-cell (spatial) methodologies deployed for their in-depth characterization. B, UMAP of the CD8+ T cells and NK cells identified by unsupervised Louvain clustering of the subset of CD8+ T/NK cells including samples from both time points. C, Dotplot of the top representative discriminatory marker genes of the cells presented in B including samples from both time points. Size of the dot represents the number of cells expressing the gene and color reflects the expression level. D, UMAP of all immune cell types and states identified by summarizing unsupervised Louvain clustering and subclustering of myeloid and CD8+T/NK cells including samples from both time points. E, Percentage of CD8+ T-cell subsets and NK cells of all immune cells compared among Before treatment (BT) and On treatment (OT) samples and both response groups (two-sided Wilcoxon test, bold text points to significant differences = P < 0.05). F, Dotplot showing expression of NK-related genes, oxidative phosphorylation (OXPHOS), and chemokines/cytokine genes (highly discriminating group 1, 2, and 3 of NK cells) acquired from Netskar and colleagues (29) and NK functional genes acquired from Tang and colleagues (8) and other genes within NK cell population across response and time point groups. Size of the dot represents the number of cells expressing the gene and color reflects the expression level. G, Violin plot showing log2-transformed gene score (AUCell) ratios (chemokine/cytokine signature vs. NK cytotoxicity signature), calculated based on genes shown in E. cDC1, conventional type 1 DCs; cDC2, conventional type 2 DCs; R, responder; NR, Non-responder; UMAP, Uniform Manifold Approximation and Projection. (A, Created with BioRender.com.)
Figure 2.
Figure 2.
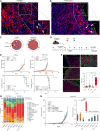
Spatial mapping of NK cells. A, Percentage of CD8+ T-cell subsets and NK cells of all immune cells plotted among three tumor-infiltrating lymphocytes: “absent” (cold), “non-brisk” (excluded), and “brisk” (hot) assessed by pathologist grouping all samples and splitting by response for the NK cells. Data analyzed by a two-sided Wilcoxon test and bold = P < 0.05. B, Representative multiplex immunofluorescence staining on lesions from an NR for whom NK cells were detected in the immune-infiltrating patch. Green = GNLY, red = melanoma, orange = CD3, and blue = CD8. Arrows point NK cells, and the dashed line represents tumor border. C, Density per square millimeter of NK cells compared between three different tumoral regions, response, and time point. Data analyzed by a two-sided Wilcoxon test and bold = P < 0.05. D, Spatial plots of all identified cells from two examples of immune-excluded tumors from skin metastasis biopsies. Arrows point toward NK cells, and the dashed line represents tumor border. E, Dotplot of expression of NK-related genes by NK cells plotted among immunophenotype and time point; BT cold, n = 1; BT excluded, n = 1; OT cold, n = 1; and OT excluded, n = 5; (F) Heatmaps of neighborhood enrichment of cell types/states identified using Xenium spatial transcriptomics for one BT excluded sample and five OT excluded samples. Cells for which abundance was <5, as well as cells annotated as either UNKNOWN or keratinocytes were removed from the neighborhood analyses. The scale represents the z-scores from a permutation test, indicating how frequently each pair of cell types was observed as neighbors compared with a randomly permuted spatial distribution. G, Stacked bar representing percentages of 20 immune cells surrounding NK cells, plotted between one BT excluded sample and five OT excluded samples. CAF, cancer-associated fibroblast; cDC1, conventional type 1 DCs; cDC2, conventional type 2 DCs; R, responder; Treg, regulatory T cell.
Figure 3.
Figure 3.
NK cells as modulators of ICB sensitivity in mice. A, Immunofluorescence of YUMM5.2 and (B) NRAS;Ink4a tumors. Tumors were stained for a melanoma marker (PDGFRa for YUMM5.2 and SOX10 for NRAS;Ink4a) and for CD45 and CD3ε to map the T-cell infiltration. Counterstaining was performed with DAPI. C, Schematic representation of NK and T-cell infiltration in the NRAS;Ink4a and YUMM5.2 tumors. D, Schematic representation of the therapeutic regimen used with YUMM5.2 and NRAS;Ink4a tumors. E, Growth curves of YUMM5.2 (top left) and NRAS;Ink4a tumors (bottom left) in vivo (n ≥ 5 per cohort (control, αPD-1, aNK1.1, and αPD-1 + aNK1.1). A Welch-corrected t test was performed on the doubling time of tumors upon exponential fitting (*, P < 0.05; **, P < 0.01). Kaplan–Meier curves representing progression-free survival of YUMM5.2 (top right) and NRAS;Ink4a tumors (bottom right) in vivo (n ≥ 5 per cohort. A log-rank Mantel–Cox test was used; *, P < 0.05; **, P < 0.01; ***, P < 0.001). F, Cryosection immunofluorescence showing the overall immune infiltrate of NRAS;Ink4a tumors across cohorts. Tumor cells were identified by S100 and immune cells by CD45. Counterstaining was performed with DAPI. The dashed line marks the separation between tumor and immune areas. Quantification of overall immune infiltration in NRAS;Ink4a tumors (number of CD45+ of all DAPI-positive cells, with n ≥ 6 per cohort and data analyzed with a Welch-corrected t test; *, P < 0.05; **, P < 0.01). G, Stacked bar plot showing proportions of immune cell types from the NRAS;Ink4a and YUMM5.2 tumors across conditions based on the scRNA-seq experiment. For each condition, at least four mice were pooled (see “Methods”). H, Growth curves (left) and doubling time calculation (right) of NRAS;Ink4a tumors in vivo treated with αPD-1 and/or aNK1.1 in the presence/absence of CD8+ T-cell depletion (n = 4 per cohort and a Welch-corrected t test was performed on the doubling time of tumors upon exponential fitting; **, P < 0.01). cDC1, conventional type 1 DCs; cDC2, conventional type 2 DCs; mDC, migratory DCs, Treg, regulatory T cell. (C and D, Created with BioRender.com.)
Figure 4.
Figure 4.
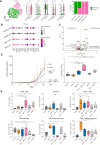
Pharmacologic targeting of NK cells. A, Uniform Manifold Approximation and Projection (UMAP) of re-clustered NK cells from the NRAS;Ink4a and YUMM5.2 tumors (left), selected genes expression between NK cell clusters (middle), and proportions of NK cells from the NRAS;Ink4a and YUMM5.2 tumors compared between control- and αPD-1–treated condition (right) based on the scRNA-seq experiment. B, Dot plot of the expression of selected genes between NRAS;Ink4a and YUMM5.2 tumors in NK cells only based on the scRNA-seq experiment. C, Volcano plot representing differentially expressed proteins in NK cells from the NRAS;Ink4a tumor between control and αPD-1 treatment. Significantly expressed proteins were considered based on the adjusted P value > 10e–3 based on the CITE-seq experiment. D, Growth curves (left) and doubling time calculation (right) of NRAS;Ink4a tumors in vivo treated with αPD-1, JMS-17-2, and CD38 (n ≥ 4 per cohort and a Welch-corrected t test was performed on the doubling time of tumors upon exponential fitting; **, P < 0.01). E, Quantification of immune cells (CD45+), NK cells (CD45+NKP46+), CD8+ T cells (CD45+CD3ε+CD8α+), and macrophages (CD45+F4/80+) in multiplexed immunofluorescence images (each dot corresponds to a single tumor; data analyzed with a Welch-corrected t test; *, P < 0.05; **, P < 0.01). Tumor rim corresponds to an area ≤0.2 mm2 in proximity to the tumor border.

References

    1. Hogan SA, Levesque MP, Cheng PF. Melanoma immunotherapy: next-generation biomarkers. Front Oncol 2018;8:178. - PMC - PubMed
    1. Cursons J, Souza-Fonseca-Guimaraes F, Foroutan M, Anderson A, Hollande F, Hediyeh-Zadeh S, et al. A gene signature predicting natural killer cell infiltration and improved survival in melanoma patients. Cancer Immunol Res 2019;7:1162–74. - PubMed
    1. Böttcher JP, Bonavita E, Chakravarty P, Blees H, Cabeza-Cabrerizo M, Sammicheli S, et al. NK cells stimulate recruitment of cDC1 into the tumor microenvironment promoting cancer immune control. Cell 2018;172:1022–37.e14. - PMC - PubMed
    1. Barry KC, Hsu J, Broz ML, Cueto FJ, Binnewies M, Combes AJ, et al. A natural killer–dendritic cell axis defines checkpoint therapy–responsive tumor microenvironments. Nat Med 2018;24:1178–91. - PMC - PubMed
    1. Spranger S, Dai D, Horton B, Gajewski TF. Tumor-residing Batf3 dendritic cells are required for effector T cell trafficking and adoptive T cell therapy. Cancer Cell 2017;31:711–23.e4. - PMC - PubMed

Substances