Review
. 2025 Jun 6;53(11):gkaf515.
doi: 10.1093/nar/gkaf515.

Next generation genetic screens in kinetoplastids

Affiliations
Review

Next generation genetic screens in kinetoplastids

James Budzak et al. Nucleic Acids Res. .

Abstract

The genomes of all organisms encode diverse functional elements, including thousands of genes and essential noncoding regions for gene regulation and genome organization. Systematic perturbation of these elements is crucial to understanding their roles and how their disruption impacts cellular function. Genetic perturbation approaches, which disrupt gene expression or function, provide valuable insights by linking genetic changes to observable phenotypes. However, perturbing individual genomic elements one at a time is impractical. Genetic screens overcome this limitation by enabling the simultaneous perturbation of numerous genomic elements within a single experiment. Traditionally, these screens relied on simple, high-throughput readouts such as cell fitness, differentiation, or one-dimensional fluorescence. However, recent advancements have introduced powerful technologies that combine genetic screens with image-based and single-cell sequencing readouts, allowing researchers to study how perturbations affect complex cellular phenotypes on a genome-wide scale. These innovations, alongside the development of CRISPR-Cas technologies, have significantly enhanced the precision, efficiency, and scalability of genetic screening approaches. In this review, we discuss the genetic screens performed in kinetoplastid parasites to date, emphasizing their application to both coding and noncoding regions of the genome. Furthermore, we explore how integrating image-based and single-cell sequencing technologies with genetic screens holds the potential to deliver unprecedented insights into cellular function and regulatory mechanisms.


Conflict of interest statement

No conflicts of interest declared.

Figures

Graphical Abstract
Graphical Abstract
Figure 1.
Figure 1.
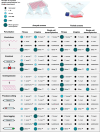
Genetic screens require a specific perturbation, scalability, and a readout. Each screen starts with specific DNA sequences encoding for specific perturbations, either a knockdown, knockout, overexpression, precision edit or gene tagging which are transfected into a cell line of interest. This transfection can either be in individual wells or flasks (arrayed) or into a single flask of cells (pooled). After incubating cells or inducing the perturbation, the effect of the perturbations is determined by a readout which can be cell fitness, imaging, or single-cell sequencing. The microscopy image shown is for PFR2 (Tb927.8.4990) and was acquired from TrypTag. The schematics used for the parasites in this and all subsequent figures were adapted from [189]. The illustrations for the flask and 96-well plate were sourced from the NIAID NIH BIOART. Source: bioart.niaid.nih.gov/bioart/303 and bioart.niaid.nih.gov/bioart/7, respectively.
Figure 2.
Figure 2.
Overview of different perturbation strategies used in kinetoplastids for genetic screens. Schematics showing different perturbation technologies used in kinetoplastids. The type of DNA (plasmid, plasmid library, PCR product, and ssODN) used with each technology is shown as is the expected perturbation outcome, either a knockdown, knockout, overexpression, precision editing, or gene tagging.
Figure 3.
Figure 3.
Overview of scale of genetic screens performed in kinetoplastids and other organisms. Comparative chart showing the number of genetic perturbations performed in a single experiment for knockdown, knockout, overexpression, precision editing, or gene tagging using either arrayed or pooled genetic screens. The size and color of the circles indicates the number of reported perturbations in a single experiment for the respective organism. “Other” refers to mammalian cells, yeast, or Drosophila. In instances where multiple publications have reported screens within the same size range, only one example is cited. Superscript numbers refer to the cited publication found in the references.
Figure 4.
Figure 4.
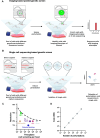
Image-based and single-cell sequencing-based pooled genetic screens. (A) Workflow for performing a pooled image-based genetic screen. A pool of cells is generated which each contain a different genetic perturbation. These cells also contain a fluorescent marker to visualize cellular DNA, RNA, protein, or other marker of interest. The perturbation library is then induced and cells with an imaging phenotype of interest are either isolated and enriched or perturbation signatures are sequenced in situ. (B) Workflow for performing pooled single-cell sequencing-based genetic screen. A pool of cells is generated in which the perturbations of interest are modified such that they can be directly or indirectly captured by poly(A) enrichment for subsequent single-cell sequencing. After inducing perturbations and isolating single cells, cells are sequenced to obtain single-cell information for each perturbation. (C) Comparison of the different technologies which can be used to isolate, enrich or directly sequence cells from pooled genetic screens based on imaging phenotypes. The maximum reported resolution and the approximate throughput (for mammalian cells) are shown for each method. The dotted line indicates the technical space which has currently been developed for pooled image-based screens. LMD, laser-assisted microdissection; PA + FACS, photoactivation + FACS; ISS, in situ sequencing; IACS, image-activated cell sorting. (D) Estimation of cost for scRNA-seq for increasing numbers of perturbations. Cost were calculated assuming 100 transcriptomes per perturbation, with a read depth of 50 000 reads per cell and an average cost per cell (reagents and sequencing) of 0.5$ using a 10x-Chromium platform.

Similar articles

References

    1. Cong L, Ran FA, Cox D et al. Multiplex genome engineering using CRISPR–Cas systems. Science. 2013; 339:819–23. 10.1126/science.1231143. - DOI - PMC - PubMed
    1. Clayton C Regulation of gene expression in trypanosomatids: living with polycistronic transcription. Open Biol. 2019; 9:190072. 10.1098/rsob.190072. - DOI - PMC - PubMed
    1. Bock C, Datlinger P, Chardon F et al. High-content CRISPR screening. Nat Rev Methods Primers. 2022; 2:8. 10.1038/s43586-021-00093-4. - DOI - PMC - PubMed
    1. Borst P, Rudenko G Antigenic variation in African trypanosomes. Science. 1994; 264:1872–3. 10.1126/science.7516579. - DOI - PubMed
    1. Rojas F, Silvester E, Young J et al. Oligopeptide signaling through TbGPR89 drives trypanosome quorum sensing. Cell. 2019; 176:306–17. 10.1016/j.cell.2018.10.041. - DOI - PMC - PubMed