. 2025 Jun 6;53(11):gkaf520.
doi: 10.1093/nar/gkaf520.

IRE1α RNase activity is critical for early embryo development by degrading maternal transcripts

Affiliations

IRE1α RNase activity is critical for early embryo development by degrading maternal transcripts

Chao Li et al. Nucleic Acids Res. .

Abstract

During maternal-to-zygotic transition, oocytes and embryos undergo massive maternal mRNA degradation. Three key events are related to RNA degradation: oocyte meiotic resumption, fertilization, and zygotic genome activation (ZGA). In this study, we unexpectedly discover that the UPR (unfolded protein response) protein IRE1α is critical for post-fertilization maternal messenger mRNA (mRNA) degradation. IRE1α is specifically expressed from the metaphase II oocytes to four-cell embryos, with its translation dependent on the ERK1/2 pathway. Oocyte-specific deletion of the IRE1α RNase domain resulted in female infertility, characterized by embryonic developmental arrest at the one-cell or two-cell stage, and failure to degrade maternal mRNAs destined for elimination. Using IRE1α-Flag knock-in mouse model and LACE-seq, as well as in vitro analysis, we show that IRE1α can directly bind and cleave maternal mRNAs after fertilization. Moreover, IRE1α-mediated mRNA decay is essential for ZGA and histone modifications. This study unveils an important function of IRE1α in early embryonic development through regulated IRE1α-dependent decay, independent of the canonical IRE1α-XBP1 signaling pathway, thereby revealing a novel molecular mechanism underlying maternal mRNA degradation triggered by fertilization.


Conflict of interest statement

None declared.

Figures

Graphical Abstract
Graphical Abstract
Figure 1.
Figure 1.
Embryos derived from IRE1α-GKO female mice were developmentally arrested. (A) RT-PCR results showing mRNA level of Ire1α in mouse oocytes and preimplantation embryos. (B) Western blot showing the protein level of IRE1α in mouse oocytes and preimplantation embryos. (C) Representative images of embryos treated with DMSO, 4μ8c (10 μM), or BI09 (10 μM) after hCG 18 h. Scale bar, 100 μm. (D) Western blot results showing the protein levels of IRE1α in zygotes of WT and Ire1α-GKO females. (E) Average number of offspring produced per WT and Ire1α-GKO females. The number of mice used: n = 5; ***P < .001 by two-tailed Student’s t-test. (F) Representative images of embryos derived from WT and IRE1α-GKO females. The red arrow indicates the pronuclear in the IRE1α-GKO embryo. Scale bar, 100 μm. (G) Developmental rates of embryos derived from WT and IRE1α-GKO females: WT, n = 43; Ire1α-GKO, n = 40; error bars, ***P < .001 by two-tailed Student’s t-test.
Figure 2.
Figure 2.
The IRE1α RNase domain deletion does not activate UPR pathways. (A) Western blot showing the phosphorylation level of eIF2α in WT and Ire1α-GKO zygotes. (B) RT-qPCR validation of Chop and Ppp1r15a in WT and Ire1α-GKO zygotes. (C) HPG staining showing the newly translated protein in WT and Ire1α-GKO zygotes. Scale bar, 10 μm. (D) HPG fluorescence intensity statistics of WT and Ire1α-GKO zygotes. ***P <.001; P-values were determined by two-tailed unpaired t-test. (E) Fluorescence microscopy results showing the location of GFP-ATF6. Scale bar, 10 μm. (F) RT-PCR showing the mRNA levels of Ddit3 and Hsp90b1 in WT and Ire1α-GKO zygotes.
Figure 3.
Figure 3.
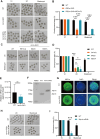
IRE1α RNase activity is important for early embryonic development. (A) Representative images of WT, Ire1α-GKO, and Ire1α-GKO + Ire1α mRNA (microinjection of Ire1α mRNA in Ire1α-GKO zygotes) embryos. Scale bar, 100 μm. (B) Statistics of the proportion of WT, Ire1α-GKO, and Ire1α-GKO + Ire1α mRNA embryo development when WT embryos reached the corresponding stages. ***P < .001, as assessed by two-tailed Student’s t-test. (C) Representative images of WT, Ire1α-Δ (microinjection of Ire1α-Δ mRNA in Ire1α-GKO zygotes), I642G (microinjection of Ire1α-I642G mRNA in Ire1α-GKO zygotes), and K907A (microinjection of Ire1α-K907A mRNA in Ire1α-GKO zygotes) embryos. Scale bar, 100 μm. (D) Statistics of the proportion of WT, Ire1α-Δ, I642G, and K907A embryo development when WT embryos reached the corresponding stages. ***P < .001, as assessed by two-tailed Student’s t-test. (E) RT-PCR showing the mRNA levels of Xbp1 in WT and Ire1α-GKO zygotes. (F) PCR showing Xbp1u and Xbp1s in WT and Ire1α-GKO zygotes. (G) immunofluorescent staining showing the XBP1s in WT and Ire1α-GKO zygotes. (H) Representative images of WT and Ire1α-GKO + Xbp1s mRNA (microinjection of Xbp1s in Ire1α-GKO zygotes) embryos. Scale bar, 100 μm. (I) Statistics of the proportion of WT and Ire1α-GKO + Xbp1s mRNA embryo development when WT embryos reached the corresponding stages. ***P < .001, as assessed by two-tailed Student’s t-test.
Figure 4.
Figure 4.
IRE1α regulates maternal mRNA decay. Volcano plot showing transcriptome changes in Ire1α knockout PN5 zygotes (A) and two-cell (B). (C) The degradation pattern of maternal transcripts in mouse embryos derived from WT and Ire1α-GKO females. (D) RT-PCR showing the relative RNA expression of upregulated transcripts in Ire1α-GKO PN5 zygotes compared to WT PN5 zygotes. ***P< .001, as assessed by two-tailed Student’s t-tests. (E) Heat map of Spearman correlation coefficients among control group, 4μ8c (10 μM) group, and APY29 (10 μM) group of PN5 zygotes. (F) Venn diagrams showing the overlap of upregulated transcripts in mouse PN5 zygotes with or without 4μ8c treatment. (G) RT-PCR showing the relative mRNA expression of transcripts of PN5 zygotes treated with 4μ8c (10 μM) and APY29 (10 μM). ***P < .001, as assessed by two-tailed Student’s t-tests.
Figure 5.
Figure 5.
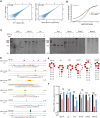
IRE1α directly cleaves maternal mRNAs. (A) Scatter plots showing the correlation between biological replicates of anti-IgG and anti-FLAG group (Pearson correlation coefficients). (B) Cumulative distribution function plot showing the transcript level changes after IRE1α depletion in zygotes. P-values were calculated by a two-tailed Kolmogorov–Smirnov test. (C) Urea-PAGE showing cleaved RNA fragments after treating with recombinant hIRE1α protein and 4μ8c in vitro. (D) Genome browser snapshot showing the read coverage of the gene locus in IRE1α-Flag LACE-seq data. The nucleotide sequences indicat potential cleavage sites in RNA. Red bases indicate motifs recognized by IRE1α. (E) Hairpin structures formed by potential cleavage sites. Red bases indicate motifs recognized by IRE1α. (F) RT-PCR showing the potential cleavage sites cleaved by IRE1α in vitro. The base sequence with a red background represents the IRE1α recognition motif.*P <.05, **P <.01, and ***P <.001 as assessed by two-tailed Student’s t-tests.
Figure 6.
Figure 6.
Ire1α depletion affects histone modification and DNA methylation. (A) Immunofluorescence staining of H3K4me3 and DNA in WT and Ire1α-GKO zygotes. Scale bar, 20 μm. (B) Fluorescence intensity statistics of Ser2p in WT and Ire1α-GKO zygotes. ***P < .001 by two-tailed Student’s t-tests. (C) Immunofluorescence staining of 5mc and 5hmc in WT and Ire1α-GKO zygotes. Scale bar, 20 μm. (D) Fluorescence intensity statistics of 5mc and 5hmc in WT and Ire1α-GKO zygotes. ***P < .001 by two-tailed Student’s t-tests.
Figure 7.
Figure 7.
ERK1/2 triggers IRE1α mRNA translation during oocyte maturation. (A) Western blot results showing levels of HSPA5 in GV, MII oocytes, and one-cell. (B) Western blot results showing levels of IRE1α in MII oocytes with or without U0126 (20 μM) treatment. (C) Western blot results showing levels of IRE1α in GV oocytes with or without MG132 (10 μM) treatment. (D) Western blot results showing levels of IRE1α in MI oocytes with or without MG132 (10 μM) treatment. (E) Western blot results showing that injected mRNAs encoded for IRE1α-GFP were stably expressed in GV oocytes and MII oocytes. Red arrow: IRE1α; green arrow: IRE1α-GFP. (F) Western blot results showing levels of IRE1α-GFP in MII oocytes with or without U0126 (20 μM) treatment. Red arrow: IRE1α; green arrow: IRE1α-GFP. (G) Western blot results showing levels of IRE1α in MII oocytes with or without CHX (20 μM) treatment at GV stages. (H) Western blot results showing levels of IRE1α in MII oocytes with or without CHX (20 μM) treatment at MI stages.

Similar articles

References

    1. Vastenhouw NL, Cao WX, Lipshitz HD The maternal-to-zygotic transition revisited. Development. 2019; 146:dev161471. 10.1242/dev.161471. - DOI - PubMed
    1. Semotok JL, Cooperstock RL, Pinder BD et al. Smaug recruits the CCR4/POP2/NOT deadenylase complex to trigger maternal transcript localization in the early Drosophila embryo. Curr Biol. 2005; 15:284–94. 10.1016/j.cub.2005.01.048. - DOI - PubMed
    1. Yang Y, Wang L, Han X et al. RNA 5-methylcytosine facilitates the maternal-to-zygotic transition by preventing maternal mRNA decay. Mol Cell. 2019; 75:1188–202. 10.1016/j.molcel.2019.06.033. - DOI - PubMed
    1. Sha QQ, Zhu YZ, Li S et al. Characterization of zygotic genome activation-dependent maternal mRNA clearance in mouse. Nucleic Acids Res. 2020; 48:879–94. 10.1093/nar/gkz1111. - DOI - PMC - PubMed
    1. Sha QQ, Zheng W, Wu YW et al. Dynamics and clinical relevance of maternal mRNA clearance during the oocyte-to-embryo transition in humans. Nat Commun. 2020; 11:4917. 10.1038/s41467-020-18680-6. - DOI - PMC - PubMed

MeSH terms

LinkOut - more resources