. 2025 Jun 6;53(11):gkaf507.
doi: 10.1093/nar/gkaf507.

Separation of telomere protection from length regulation by two different point mutations at amino acid 492 of RTEL1

Affiliations

Separation of telomere protection from length regulation by two different point mutations at amino acid 492 of RTEL1

Riham Smoom et al. Nucleic Acids Res. .

Abstract

RTEL1 is an essential DNA helicase that plays multiple roles in genome stability and telomere length regulation. The ultra-long telomeres of the house mouse hinder its utility as a model for telomere-related diseases. We have previously generated a mouse model with human-length telomeres, termed "Telomouse," by substituting methionine 492 of mouse Rtel1 to a lysine (Rtel1M492K). In humans, a methionine to isoleucine mutation at this position causes the fatal telomere biology disorder Hoyeraal-Hreidarsson syndrome (HHS). Here, we introduced the Rtel1M492I point mutation into the mouse genome, generating another mouse model, which we termed "HHS mouse." The HHS mouse telomeres are not as short as those of the Telomouse but nevertheless display higher levels of telomeric DNA damage, fragility, and recombination, associated with anaphase bridges and micronuclei. The HHS mouse also exhibits aberrant hematopoiesis and pre-fibrotic alterations in the lung. These observations indicate that the two mutations at the same codon separate critical functions of RTEL1: Rtel1M492K mainly reduces the telomere length setpoint, while Rtel1M492I predominantly disrupts telomere protection. The two mouse models enable dissecting the mechanistic roles of RTEL1 and the different contributions of short telomeres and DNA damage to telomere biology disorders and genomic instability.


Conflict of interest statement

None declared.

Figures

Graphical Abstract
Graphical Abstract
Figure 1.
Figure 1.
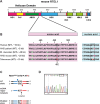
Derivation of the Rtel1M492I allele by CRISPR–Cas9 nickase editing. (A) A scheme showing the helicase domains (HD1 and HD2), the iron–sulfur cluster (FeS), the nuclear localization signal, harmonin N-like domains (HNL1 and HNL2), PCNA-interacting protein motif, and the C4C4 ring-finger domain [13] of RTEL1. (B) RTEL1 protein and DNA sequence alignment showing codon 492 (boxed) and flanking sequences in human and mouse. Variations in mouse from the human sequence are shown in green, and mutations in HHS patients and mouse models are shown in red. (C) Illustration showing the WT allele, the two positions targeted by gRNAs (blue and red arrowheads), the ssDNA repair template with the mutation, left homology arm (blue), right homology arm (red), and the resulting mutant allele. (D) Sanger sequencing of the HHS mouse founder line confirming the replacement of the “G” with a “T” in codon 492, changing the methionine to an isoleucine.
Figure 2.
Figure 2.
Telomeres of MEFs carrying the homozygous Rtel1M492I mutation progressively shorten with cell division in culture. MEF cultures were generated from F3 littermate Rtel1I/I, Rtel1M/I, and Rtel1M/M* embryos generated by mating F2 heterozygous mice for the Rtel1M492I mutation. Another WT MEF culture (Rtel1M/M) was generated by intercrossing WT mice to avoid trans-generational inheritance of short telomeres from heterozygous Rtel1 mutant mice to the WT offspring. All four cell lines were immortalized by serial passaging and grown to PD 250. (A) Genomic DNA samples extracted from the indicated MEF cultures and PDs were digested by HinfI restriction endonuclease and analyzed by PFGE, denaturation, and in-gel hybridization with a C-rich telomeric probe. MTL was quantified for each sample by TeloTool [34] and indicated below the lanes. (B) MTL values measured in multiple gels for the same Rtel1M/M, Rtel1I/I, and Rtel1M/I MEFs samples (Supplementary Fig. S1). For comparison, MTL values for Rtel1K/K and Rtel1M/K MEFs were imported from [8]. (C) Telomeres from the indicated cultures at PD 250 were sequenced by NanoTelSeqRtel1I/I or re-basecalled and processed from the raw data of previous sequencing reactions (Rtel1M/M and Rtel1K/K) reported in [8]. Scatter plots show the individual telomere length of the indicated MEF cultures. Mean and standard deviation (SD) are indicated by horizontal lines. Median values in kb are indicated to the right of each scatter plot, and n indicates the number of telomeric reads. The details of all individual telomere reads are shown in Supplementary Table S2.
Figure 3.
Figure 3.
HHS mouse telomeres progressively shortened over generations but less than Telomice telomeres. Genomic DNA samples extracted from blood leukocytes (A) or tails (B) of HHS or WT mice at the indicated generations and ages were analyzed by PFGE and in-gel hybridization to the denatured DNA. Representative gels are shown here and additional gels in Supplementary Fig. S5. All MTL values measured were plotted for the blood (C) and tail (D) samples. Data for WT mice and Telomice were adapted from [8]. The best-fit regression lines are shown (second-order polynomial for the HHS mice blood and fourth-order polynomial for tail). The average ages of the mice sampled were 329 days for HHS mice, 331 days for Telomice, and 355 days for WT mice. All HHS mouse data are summarized in Supplementary Table S3. (E) Scatter plots show the length of individual telomeres in the indicated mouse samples measured by NanoTelSeq. WT mouse, Telomouse, and HHS mouse were all 13 months old. Mean and SD are indicated by horizontal lines. Median values in kb are indicated to the right of each plot and the percentage of telomeres below 3 and 2 kb is to the left of the plots. n indicates the number of telomeric reads. The details of all individual telomere reads are summarized in Supplementary Table S2.
Figure 4.
Figure 4.
The HHS mutation impairs telomere protection and genome stability. (A) The formation of DDR foci and their localization to telomeres (defined as TIF) in interphase nuclei were examined by immunofluorescence staining with antibodies for the DDR marker γH2AX (green) and the telomere protein TRF2 (red). (B) Scatter plots show the number of DDR foci per nucleus (110 Rtel1M/M, 110 Rtel1K/K, and 153 Rtel1I/I nuclei were counted) and the number of TIF per nucleus (110 Rtel1M/M, 110 Rtel1K/K, and 182 Rtel1I/I nuclei were counted). The mean and SD values are indicated by black lines, and P-values were calculated by unpaired t-test. (C) Representative images of cells with micronuclei. The bar graph on the right shows the percentage of cells with micronuclei in three experiments each (represented by individual dots). A total number of 568 Rtel1M/M, 371 Rtel1K/K, and 611 Rtel1I/I cells were counted.
Figure 5.
Figure 5.
HHS MEF telomeric DDR occurs at chromosome ends with detectable telomeric signals. (A) Metaphase TIF (indicated by white arrows) were analyzed by IF-FISH using a γH2AX (green) antibody and a telomeric C-probe (red). Two experiments with a total of 64 metaphases were quantified for each WT (Rtel1M/M; PD 261) and HHS (Rtel1I/I; PD 259) MEF culture. Shown are the number of TIF per metaphase at chromosome ends with (B) or without (C) telomeric signal. The data for the Rtel1K/K and Rtel1M/M MEFs shown on the right panels are adapted from [8]. The mean and SD for TIF are indicated by black lines. P-values were calculated by two-tailed paired t-test. (D) Examples of abundant pairs of Rtel1I/I (I, II) and Rtel1M/I (III) MEF nuclei that are connected by anaphase bridges and at least one nucleus of the pair displays overt DDR. (E) Typical pairs of Rtel1K/K (I, II) and Rtel1M/K (III) MEF nuclei connected by anaphase bridges do not display overt nuclear damage. (F) Bar graphs show the percentage of bridged nuclei with overt DDR shown in panel (D). Three experiments with a total number of 376, 428, and 334 nuclei of Rtel1I/I, Rtel1M/M, and Rtel1K/K, respectively, were quantified. P-values were calculated by two-tailed unpaired t-test.
Figure 6.
Figure 6.
Increased telomeric and genomic aberrations in HHS MEFs. (A) Representative images for metaphase chromosomes of WT (Rtel1M/M) and HHS mouse (Rtel1I/I) MEFs at PD 250, hybridized with a telomeric probe (red). Colored arrows indicate chromosomal aberrations as in panel (C). (B) Scatter plots showing the average number of each aberration type per metaphase (normalized to the number of chromosomes counted). Horizontal lines show mean and SD. Six hundred nineteen chromosomes (15 metaphases) Rtel1M/M PD250 and 692 chromosomes (17 metaphases) Rtel1I/I PD 250 were quantified. P-values were calculated by unpaired two-tailed t-test. (C) Representative images of aberration types in Rtel1I/I MEFs are shown: TL, telomere fragility, and ITS. (DF) Genomic abnormalities associated with the M492I mutation, including connected nuclei, chromosome fragments, mitotic catastrophe, micronuclei, and anaphase bridges.
Figure 7.
Figure 7.
Elevated homologous recombination between sister telomeres in HHS MEFs. CO-FISH was performed on WT (M/M), Telomouse (K/K), and HHS (I/I) MEF cultures at PD104, PD105, and PD106, respectively. Nascent leading and lagging telomeres were labeled with green and red (respectively) strand-specific PNA probes. (A,B) Shown are examples of T-SCE events in M/M and I/I MEFs. (C) T-SCE events (indicated by arrows) were counted and presented as a percentage of the number of detectable telomeres in each metaphase. Twenty metaphases were quantified for each culture. Horizontal lines show mean and SD. P-value was calculated by two-tailed paired t-test.
Figure 8.
Figure 8.
HHS mouse show aberrations in the hematopoietic system. (A) TIF in blood leukocytes were analyzed by IF-FISH using anti-γH2AX (green) antibody and a telomeric C-probe (red). (B) Twenty to thirty nuclei were counted for each WT mouse (M/M), Telomouse (K/K), and HHS mouse (I/I) sample (three mice each genotype, all at nearly the same age). Each bar indicates the average number of TIF for each genotype, with dots indicating the average for each mouse. The mean and SD for TIF are indicated by black lines. P-values were calculated by nested t-test. (C) Representative images showing abnormally elongated erythrocytes in the blood of the HHS but not in the WT mouse. (D) CBC reveals a myeloid bias, with significant differences in platelets, lymphocytes, and granulocytes between HHS and WT mouse (five mice each). (E) Bone marrow was isolated from long bones (leg femur and tibia) of HHS mice and WT mice (three mice each). Flow cytometry results reveal a significant increase in the percentage of HSCs in the HHS. P-values in (D and E) were calculated by two-tailed unpaired t-test.
Figure 9.
Figure 9.
Increased collagen level and impaired lung physiology in HHS mice with age. (A) Quantification of hydroxyproline levels in lung tissue from one-year-old HHS mice compared to WT controls. HHS mice exhibit a significant increase in hydroxyproline content, indicating enhanced collagen deposition in the lung. Relative expression levels of collagen-related genes in lung tissue assessed by qPCR: (B) Col1a1and (C) Col3a1. Gene expression levels are normalized to housekeeping genes and presented as fold change relative to WT. (D) PV loop analysis of lung function. HHS mice exhibit a reduced PV loop area, indicating impaired lung compliance and diminished lung volume recruitment. (E) Quantification of hysteresis in the PV loop. HHS mice display decreased hysteresis, suggesting reduced energy dissipation and abnormal lung mechanics. (F) Elastance of the respiratory system (Ers) is significantly increased in HHS mice, reflecting increased overall lung stiffness and reduced compliance. (G) Tissue elastance (H) is elevated in HHS mice, indicating increased intrinsic lung stiffness and impaired lung elasticity. Tissue damping (G), a measure of energy dissipation within the lung parenchyma, is higher in HHS mice, suggesting increased airway resistance and altered alveolar mechanics. All data are presented as mean ± standard error of mean.
Figure 10.
Figure 10.
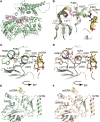
Structural models of the human and mouse RTEL1 helicase domains. (A) A model of the mouse helicase domain of RTEL1 generated by AlphaFold [35]. (B) Overlay of the region of the human (wheat) and mouse (pale green) RTEL1 helicase domains containing residue 492. Residues V485 and L455, implicated in the subtle reorganization of that region of the protein in the presence of the M492I mutation, and residues K257 and E261, affecting DNA binding, are shown in “stick” format. The displacement of this helix and the adjacent strand between the two species are highlighted in dashed boxes. Interactions of the mouse (C) and human (D) M492 with the surrounding residues, and of K257 and E261 with the ssDNA. The mouse (E) and human (F) RTEL1 structures in panels (C) and (D) are rotated 90° to show the positions of M492, L710, and G739, all of which are presumably involved in POLDIP3 binding [49].

Update of

References

    1. de Lange T Shelterin-mediated Telomere protection. Annu Rev Genet. 2018; 52:223–47. 10.1146/annurev-genet-032918-021921. - DOI - PubMed
    1. Takai H, Aria V, Borges P et al. CST-polymerase alpha-primase solves a second telomere end-replication problem. Nature. 2024; 627:664–70. 10.1038/s41586-024-07137-1. - DOI - PMC - PubMed
    1. Blackburn EH, Collins K Telomerase: an RNP enzyme synthesizes DNA. Cold Spring Harb Perspect Biol. 2011; 3:a003558. 10.1101/cshperspect.a003558. - DOI - PMC - PubMed
    1. Nassour J, Przetocka S, Karlseder J Telomeres as hotspots for innate immunity and inflammation. DNA Repair (Amst). 2024; 133:103591. 10.1016/j.dnarep.2023.103591. - DOI - PMC - PubMed
    1. Lansdorp PM Telomeres, aging, and cancer: the big picture. Blood. 2022; 139:813–21. 10.1182/blood.2021014299. - DOI - PMC - PubMed

MeSH terms

Supplementary concepts

LinkOut - more resources