. 2025 Aug;266(4-5):405-420.
doi: 10.1002/path.6435. Epub 2025 Jun 18.

Development and characterisation of improved unifocal primary mouse lung cancer models with metastatic potential

Affiliations

Development and characterisation of improved unifocal primary mouse lung cancer models with metastatic potential

Ana-Rita Pedrosa et al. J Pathol. 2025 Aug.

Abstract

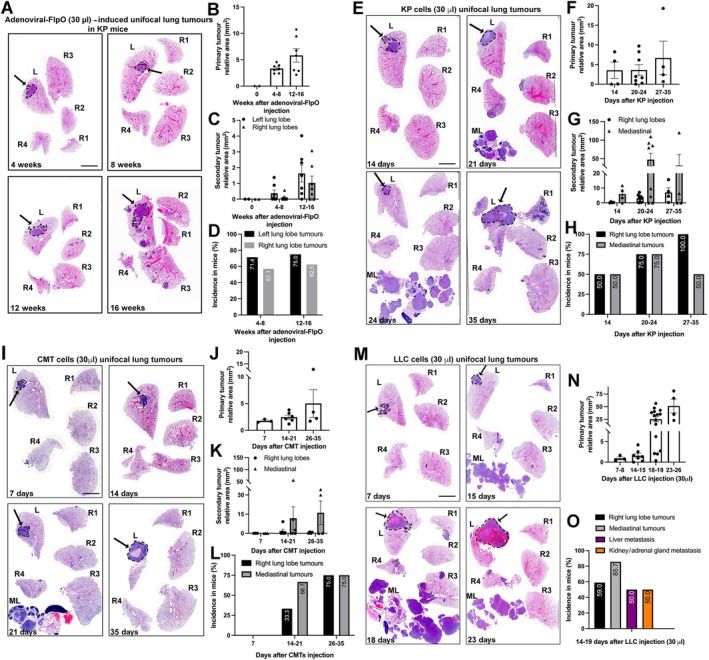
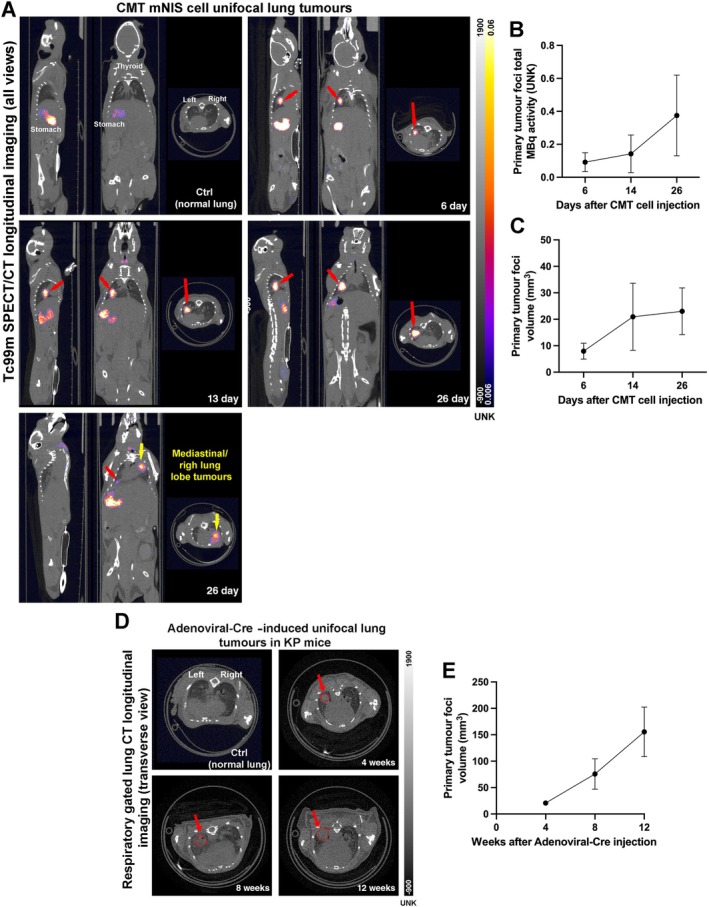
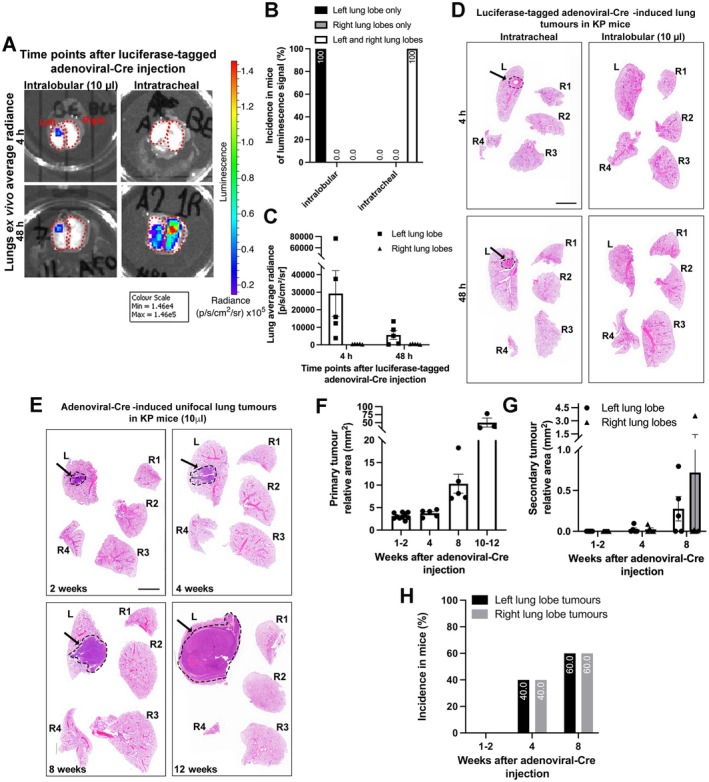
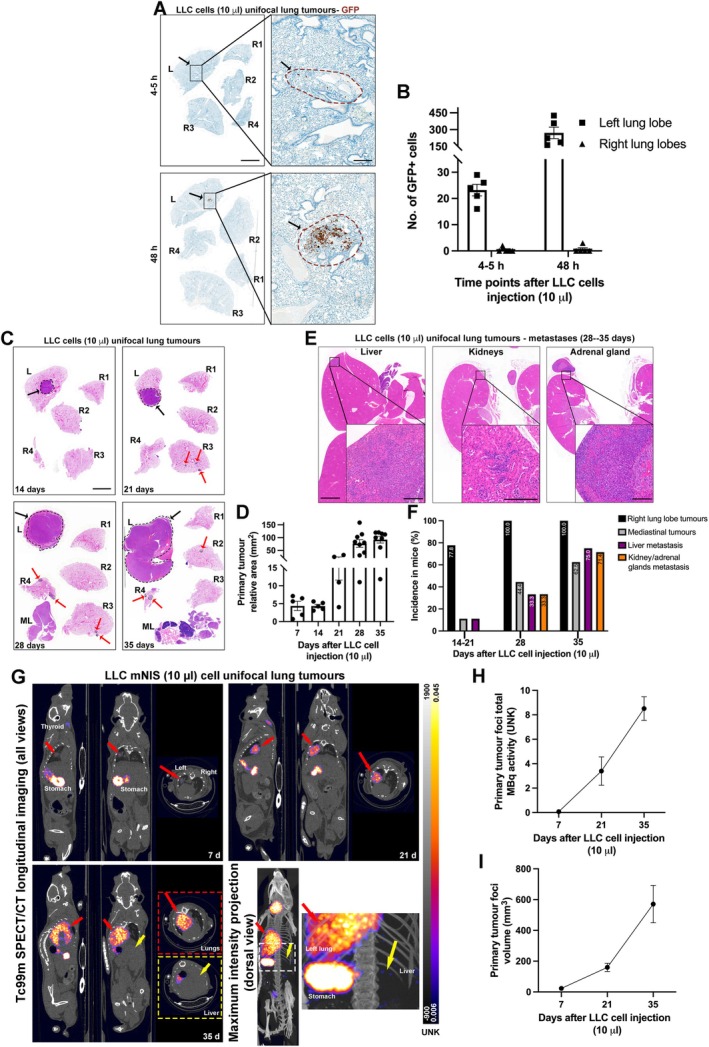
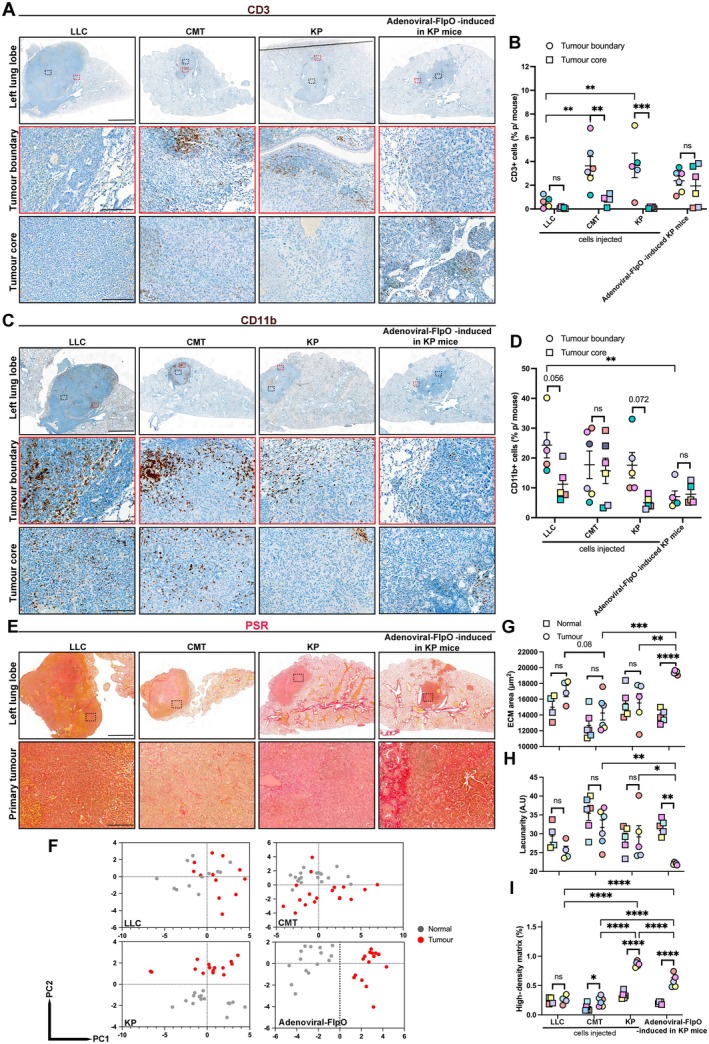
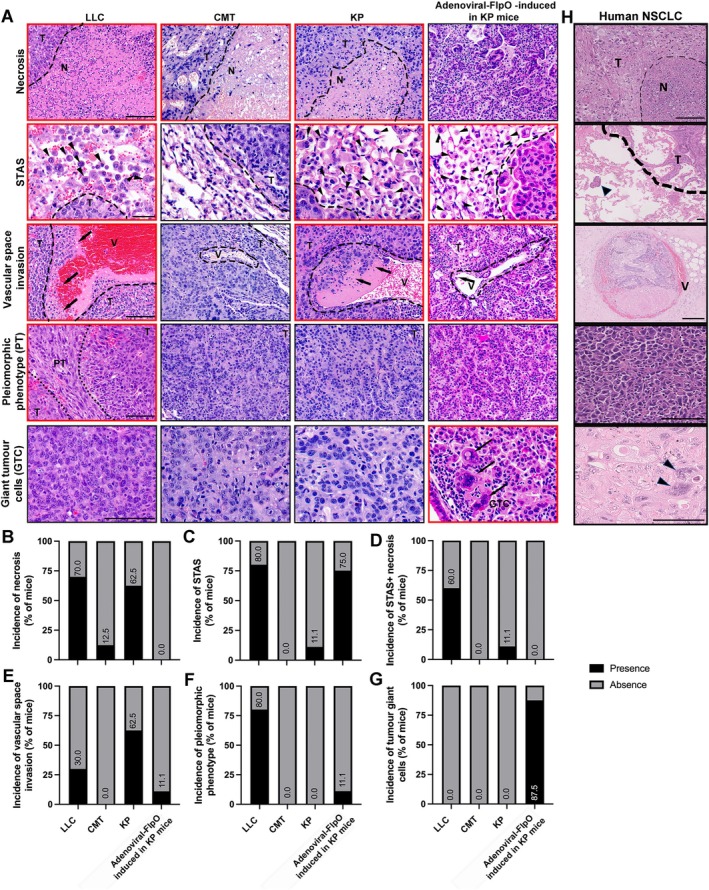
Lung cancer is the leading cause of cancer-related death globally. To better understand the biology of lung cancer, mouse models have been developed using either tail vein-injected tumour cell lines or genetically modified mice. The current gold-standard models typically present with multiple lung foci. However, although these models are widely used, their correlation with human disease are limited, as early-stage human lung cancer usually presents as a single lesion rather than multiple foci. Additionally, a major challenge of using multifocal lung tumour models is the difficulty in distinguishing primary lung tumours from intrathoracic metastasis and lethal levels of lung congestion before distant metastases develop. Here, we present a refined and detailed surgical method in which murine tumour cells [Lewis lung carcinoma (LLC), alveogenic lung carcinoma (CMT), or Kras/Trp53-KP mutant cells] were injected directly into the left lung lobe of C57BL/6 mice, or, alternatively, adenoviral-Cre or adenoviral-FlpO was administered directly into the left lung lobe of KrasLSL-G12D;Trp53fl/fl or KrasFSF-G12D;Trp53frt/frt (KP) mice, respectively. This method generated unifocal primary left lung lobe tumours with traceable spread to local and distant sites. A cross-comparison of the unifocal models described commonalties and differences between LLC, CMT, KP cells, and adenoviral-Cre or -FlpO methods in terms of timings for primary lung tumour growth and traceable spread to local and distant sites, histological analysis of CD3 and CD11b immune cell infiltration, and Picrosirius Red analysis of extracellular matrix complexity. Lastly, the frequency of clinical histopathological features typical of human lung cancer were assessed across the unifocal mouse models to provide a direct comparison with human lung cancer. Overall, this study details a refined and reproducible protocol for intralobular lung injection to generate unifocal lung cancer models that resemble key features of human lung cancer. This approach can be applied to other lung cancer initiation strategies. The cross-comparative histological analysis across the models tested here offers a valuable resource to aid researchers in selecting the most appropriate next-generation unifocal lung cancer models for their specific research needs. © 2025 The Author(s). The Journal of Pathology published by John Wiley & Sons Ltd on behalf of The Pathological Society of Great Britain and Ireland.

Keywords: SPECT/CT; Unifocal; histopathological features; immune infiltration; lung cancer; matrix remodelling; metastasis; non‐small cell lung cancer (NSCLC) preclinical mouse models; sodium iodide symporter.


Figures

Figure 1
Figure 1
Unifocal lung tumours induced by adenoviral‐FlpO in KP GEM mice or cells injected into C57Bl6 mice. (A) Representative whole‐lung H&E staining at different time points after adenoviral‐FlpO injection in KP GEM mice. Dashed black lines and arrows identify primary tumour foci in left lung lobes. Dotted black lines denote right lung lobe tumours. (B and C) Bar graphs denote primary tumour relative area and secondary tumours relative area (from H&E image, mm2) in time course after adenovirus injection, respectively. Each dot represents a single mouse. (D) Bar graph denoting incidence in mice of right lung lobe tumours (expressed as a percentage of total mice at each time point after injection). n = 2 mice at 0 weeks; n = 7 mice at 4–8 weeks; n = 7 mice at 12–16 weeks. (E, I, and M) Representative H&E‐stained sections of lungs at time points after KP, CMT and LLC cells 30 μl injection respectively. Dashed black lines and arrows highlight primary tumour foci in left lung lobes. Dotted black lines denote right lung lobe tumours. ML, mediastinal lymph nodes with presence of tumour. (F, J, and N) Bar graphs denoting primary tumour relative area in time courses after KP, CMT, LLC 30‐μl cell injection respectively. (G and K) Bar graphs denoting secondary right lung lobe and mediastinal tumours relative area (from H&E‐stained sections, mm2) in time courses after KP and CMT 30‐μl cell injection. Each dot represents a single mouse. (H and L) Bar graphs denoting incidence in mice of right lung lobe tumours (black bars) and mediastinal tumours (grey bars) (expressed as a percentage of total mice at each time point after injection) in KP and CMT injected models. (O) Bar graphs denoting incidence in mice of right lung lobe tumours (black bars), mediastinal tumours (grey bars), liver metastasis (purple bars), and kidney/adrenal gland metastases (orange bars), expressed as a percentage of total mice after injection. For KP injected mice, n = 4 mice at 14 days; n = 8 mice at 20–24 days; n = 4 mice at 27–35 days. For CMT injected mice, n = 3 mice at 7 days; n = 6 mice at 14–21 days; n = 4 mice at 26–35 days; For LLC injected mice (30 μl), n = 3 mice at 7–8 days; n = 7 mice at 14–15 days; n = 15 mice at 18–19 days; n = 4 mice at 23–26 days. Scale bar, 4 mm.
Figure 2
Figure 2
In vivo SPECT/CT longitudinal imaging to track growth of left lung lobe primary tumour and metastasis development in unifocal lung intralobular models. (A) Representative SPECT/CT overlaid images (all views) of progressive time points after CMT murine sodium iodide symporter (mNIS) cell injection into left lung lobe. Top left quadrant: control mouse (not injected with cells; Ctrl) with no Tc99m uptake in lungs (signal from stomach, thyroid, and bladder constitutes normal physiological uptake of radionuclide in these organs). Red arrows highlight primary tumour injection site in the left lung lobe with high Tc99m uptake signal that increases over time. Bottom left quadrant: mouse with right lung and/or mediastinal tumours highlighted by yellow arrow. Please note that the image is taken in plane to visualise the mediastinal tumour that is not in the same plane as the primary left lung lobe tumour. Scale bars for both CT and non‐calibrated SPECT signals are shown on the right of the panel. (B) Primary tumour total MBq activity line graph represents total amount of Tc99m activity (UNK) in total volume of primary tumour, over time. (C) Primary tumour volume line graph represents total volume (mm3) increase over time. n = 4 mice/time point (6, 14, and 26 days). (D) Representative respiratory gated ultra‐focus thorax CT images (transversal view) of progressive time points after adenoviral‐Cre left lung lobe injection into KP GEM mice. Top left quadrant: control mouse (not injected with virus; Ctrl) denoting normal structures of lungs. Red arrows and dashed lines highlight primary tumour foci in left lung lobe that increases over time. (E) Primary tumour volume line graph represents total volume (mm3) increase over time. n = 5 mice/time point (4, 8, and 12 weeks).
Figure 3
Figure 3
Refined unifocal lung tumours induced by adenoviral‐Cre in KP GEM mice (using 10 μl volumes with high‐concentration Matrigel). (A) Luciferase‐tagged adenoviral‐Cre was either injected intralobularly into the left lung lobe of KP GEM mice to generate a single primary tumour focus (0.8 × 107 PFU with high concentration Matrigel in 10‐μl injection volume) or administered intratracheally (1.25 × 107 PFU with MEM in 60‐μl injection volume). Mice were culled and lungs imaged ex vivo using IVIS at 2–4 and 48 h after injection to assess leakage from primary tumour injection site. Representative images of lung dorsal view radiance at different time points after injection. Dotted red lines represent left and right lung lobes and intensity of radiance is seen in lungs according to scale on right. (B) Bar graph denoting incidence of luminescence signal detected in left lung lobe alone, right lung lobe alone, or both (considering both dorsal and ventral lung views), expressed as a percentage of total mice, combining the acute time points, 4 and 48 h (and only including mice that had signal present). n = 3 mice, intratracheal and n = 8 mice, intralobular. (C) Bar graph denotes left lung lobe average radiance (p/s/cm2/sr) calculated by summing the dorsal view radiance and ventral view radiance in left lung lobe for intralobular model. Each dot represents a mouse. n = 5 mice for 4 h; n = 5 mice for 48 h. (D and E) Representative H&E‐stained sections of lungs at (D) 4 and 48 h time points after adenoviral‐Cre intralobular injection or intratracheal administration, and (E) 2, 4, 8, and 12 weeks, after intralobular injection. Dashed black lines and black arrows highlight injected site in left lung lobes (D). (F and G) Bar graphs denote primary tumour relative area and secondary tumours relative area (from H&E image, mm2) in time course after adenovirus injection. Each dot represents a single mouse. Scale bar, 4 mm. (H) Bar graph denoting incidence of mice that presented right lung lobe tumours (expressed as a percentage of total mice at each time point after injection, excluding the 10‐ to 12‐week time points, as mice had primary tumours that encompassed the whole left lung lobe). n = 10 mice at 1–2 weeks; n = 5 mice at 4 weeks; n = 5 mice at 8 weeks; n = 3 mice at 10–12 weeks.
Figure 4
Figure 4
Refined unifocal lung tumours induced by LLC cells injected into C57Bl6 mice using 10‐μl volumes with high‐concentration Matrigel. (A) Representative immunohistochemistry of GFP (DAB with haematoxylin blue counterstain), in lungs at acute time points (4 and 48 h) after LLC murine sodium iodide symporter (mNIS) GFP injection (3,300 cells in 10‐μl volumes with high‐concentration Matrigel). Black arrows, black boxes, and dashed brown lines denote injection site, which is shown in higher magnification on the right. Scale bar, 4 mm at low magnification and 0.4 mm at high magnification. (B) Bar graph showing number of GFP‐positive cells present in lungs. Each dot represents values for a single mouse. Data given as mean ± SEM. (C and E) Representative H&E‐stained sections of lungs, and metastatic organs, at different time points after 10‐μl injection of LLC cells. Dashed black lines and black arrows highlight primary tumour foci in left lung lobes; dotted black lines and red arrows denote secondary right lung lobe tumours; ML, mediastinal lymph nodes with presence of tumour. Scale bars, 4 mm for lungs in panel (C), 2 mm for organs at low magnification, and 0.2 mm for organs at high magnification in panel (E). (D) Bar graphs denoting primary tumour relative area in time courses after LLC 10‐μl cell injection. Each dot represents values for a single mouse. Data given as mean ± SEM. (F) Bar graphs denoting incidence in mice of right lung lobe tumours (black bars), mediastinal tumours (grey bars), liver metastasis (purple bars), and kidney and adrenal gland metastasis (orange bars), expressed as a percentage of total mice after injection, in time course after 10‐μl LLC injection; n = 5 mice at 4–5 h, n = 5 mice at 48 h, n = 7 mice at 7 days, n = 5 mice at 14 days, n = 4 mice at 21 days, n = 9 mice at 28 days and n = 8 mice at 35 days. (G) Representative SPECT/CT overlaid images (all views) of progressive time points after LLC mNIS cell injection (10 μl) into left lung lobe (signal from stomach, thyroid, and bladder constitutes normal physiological uptake of radionuclide in these organs). Red arrows and red dashed square highlight primary tumour foci in left lung lobe with high Tc99m uptake signal that increases over time. Yellow arrows and yellow dashed square highlight extra‐thoracic metastasis with transverse view at level of liver. Bottom right quadrant shows a maximum‐intensity projection with dorsal view and amplified region denoting by a yellow arrow several small hot spots at level of liver. Scale bars for both CT and non‐calibrated SPECT signals are shown on right of panel. (H) Primary tumour total MBq activity line graph represents total amount of Tc99m activity (UNK) in total volume of primary tumour, over time. (I) Primary tumour volume line graph represents total volume (mm3) increase over time. n = 8 mice at 7 days and 21 days, n = 3 mice at 35 days.
Figure 5
Figure 5
Characterisation of lymphocytic and myeloid immune cell infiltration and ECM pattern of normal and tumour tissue in unifocal lung intralobular models. (A and C) Representative immunohistochemistry images of CD3 and CD11b (DAB with haematoxylin blue counterstain) respectively of primary left lung unifocal tumours (in unifocal LLC, CMT, and KP cells and adenoviral‐FlpO‐induced tumours in KP GEM mice). Upper row: low‐magnification images. Black dashed boxes, tumour core; red dashed boxes, tumour boundary and tumour core presented at higher magnification in lowers rows. (B and D) Scatter dot plots showing percentage of CD3‐ and CD11b‐positive cells, respectively, in each intralobular model. Each dot represents a mouse. Data given as mean ± SEM. LLC, n = 5 mice; CMT, n = 6 mice; KP, n = 5 mice; adenoviral‐FlpO in KP mice, n = 6 mice (only mice with established tumours were used). (E) Representative immunohistochemistry images of Picrosirius Red (PSR in red and Weigert's haematoxylin in brown/orange) of primary left lung unifocal tumours, denoting higher‐magnification images (dashed rectangles show location of higher magnification images in left lung lobe lower magnification images). (F) PCA plots show overall ECM architecture in lung tumours (red dots) and their corresponding normal regions (grey dots) in LLC, CMT, KP, and adenoviral‐FlpO in KP mice models. (G–I). Dot plots showing measurements: (G) ECM area (in μm2), (H) Lacunarity (measure of how ECM fills space in arbitrary units), and (I) high‐density matrix (as percentage) in tumour compared with normal tissue. Each dot represents one mouse. LLC, n = 4 mice; CMT, n = 6 mice; KP, n = 5 mice; adenoviral‐FlpO in KP mice, n = 5 mice (only mice with established tumours were used). Two‐way ANOVA with Tukey's multiple comparisons test was used. ns, not significant; *p ≤ 0.05; **p ≤ 0.01; ***p ≤ 0.001; ****p ≤ 0.001). P values are also given as numerical values for some comparison. Scale bars, 2 mm at lower magnification (upper panels), 0.2 mm at higher magnification (middle and bottom panels).
Figure 6
Figure 6
Comparison of clinical histopathological features of human NSCLC with mouse unifocal lung intralobular models. (A) Representative H&E images of necrosis, STAS, vascular space invasion, pleiomorphic phenotype (PT), and GTC histopathological features in mouse unifocal left lung lobe intralobular models (LLC, CMT, KP cells, and adenoviral‐FlpO in KP mice). Images with red borders show respective features, whereas images with black boxes lack specific histopathological features. Black dashed lines denote separation of tumour areas [T; necrotic areas (N); boundary or limit of tumour (in STAS images); separation of tumour and vessels (V); and separation of PT from non‐pleiomorphic areas (T)]. Black arrowheads in STAS images represent presence of tumour cells in 1 or more airspaces beyond the boundary of the tumour; long black arrows represent tumour cell invasion into the vasculature. Scale bars, 0.1 mm in first, third and fourth row panels; 40 μm in second row panels. (B–G) Incidence of histopathological features expressed as a percentage of total mice, in established tumours (in LLC, CMT, KP cells, and adenoviral‐FlpO in KP mice). n = 10 mice for LLC; n = 8 for CMT; n = 8 for KP; n = 8 for adenoviral‐FlpO‐induced tumours in KP mice. (H) Representative H&E images of necrosis, STAS, vascular space invasion, PT, and GTC histopathological features in human primary NSCLC samples.

Similar articles

References

    1. Quint LE, Tummala S, Brisson LJ, et al. Distribution of distant metastases from newly diagnosed non‐small cell lung cancer. Ann Thorac Surg 1996; 62: 246–250. - PubMed
    1. Chen R, Manochakian R, James L, et al. Emerging therapeutic agents for advanced non‐small cell lung cancer. J Hematol Oncol 2020; 13: 58. - PMC - PubMed
    1. Remon J, Soria JC, Peters S, et al. Early and locally advanced non‐small‐cell lung cancer: an update of the ESMO clinical practice guidelines focusing on diagnosis, staging, systemic and local therapy. Ann Oncol 2021; 32: 1637–1642. - PubMed
    1. Kellar A, Egan C, Morris D. Preclinical murine models for lung cancer: clinical trial applications. Biomed Res Int 2015; 2015: 621324. - PMC - PubMed
    1. Hynds RE, Frese KK, Pearce DR, et al. Progress towards non‐small‐cell lung cancer models that represent clinical evolutionary trajectories. Open Biol 2021; 11: 200247. - PMC - PubMed

Substances