

Shifting and expanding ranges of a sub-Arctic caribou herd and associated changes in vegetation
- PMID: 40530805
- PMCID: PMC12175647
- DOI: 10.1002/eap.70038
Shifting and expanding ranges of a sub-Arctic caribou herd and associated changes in vegetation
Abstract
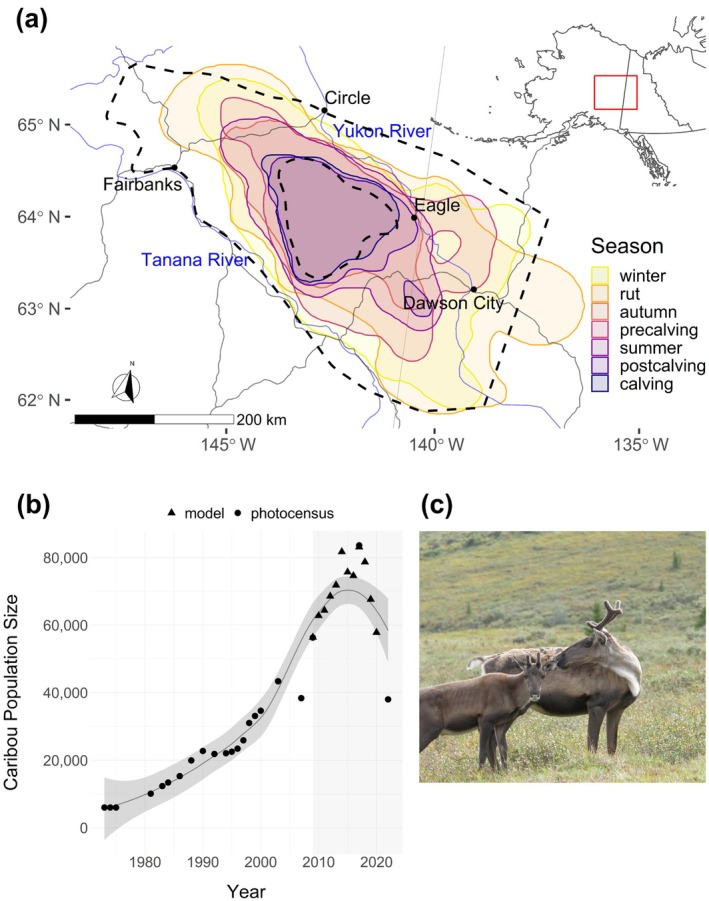
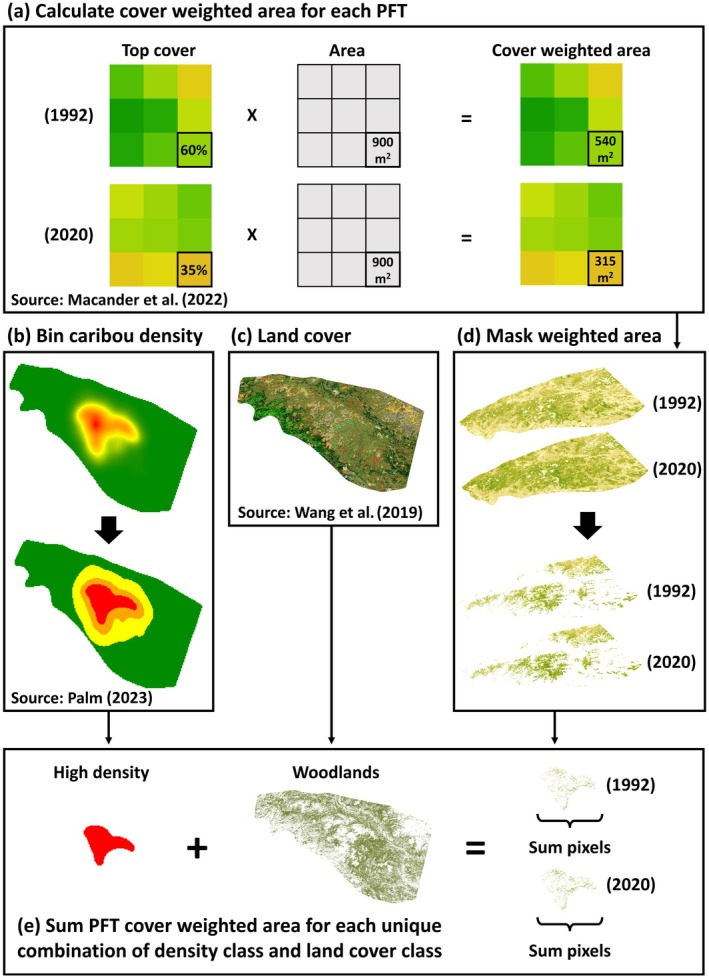
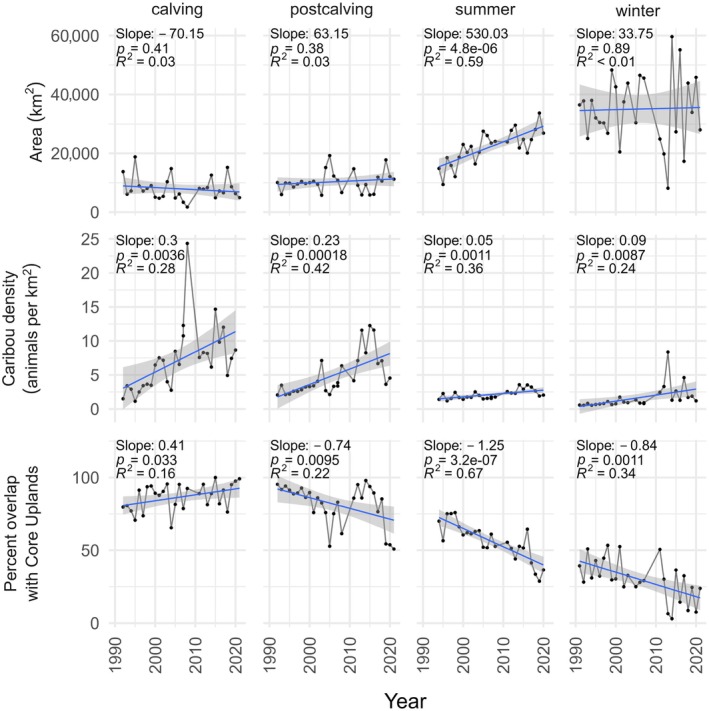
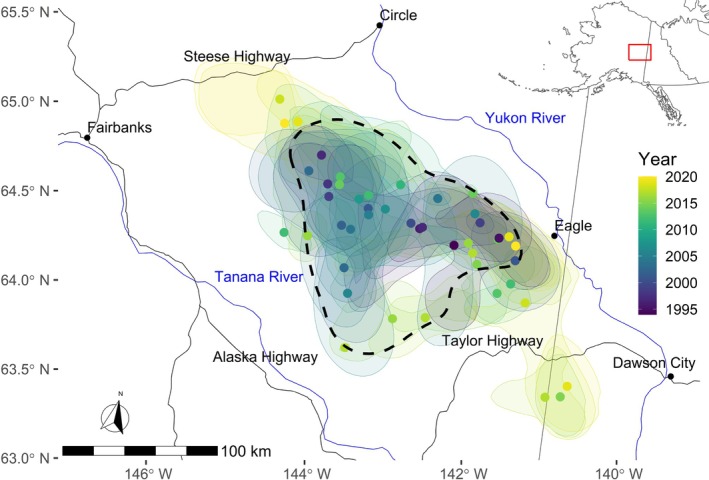
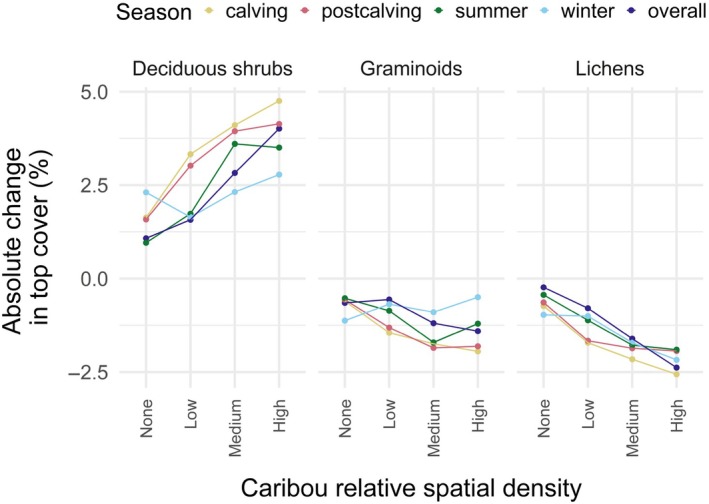
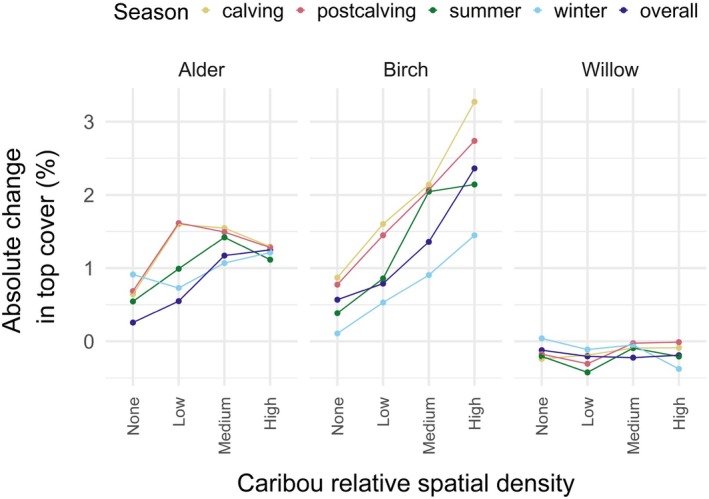
Rapid climate warming has contributed to significant changes in Arctic and boreal vegetation over the past half century. Changes in vegetation can impact wildlife by altering habitat and forage availability, which can affect behavior and range use. However, animals can also influence vegetation through foraging and trampling and therefore play an important role in determining ecosystem responses to climate change. As wildlife populations grow, density-dependent processes can prompt range expansion or shifts. One mechanism for this is density-dependent forage reduction, which can contribute to nutritional stress and population declines, and can also alter vegetation change trajectories. We assessed the range characteristics of a migratory caribou (Rangifer tarandus) herd in east-central Alaska and west-central Yukon Territory as it grew (1992-2017) then declined (2017-2020). Furthermore, we analyzed the correlation between caribou relative spatial density and vegetation change over this period using remotely sensed models of plant functional type cover. Over this period, caribou population density increased in all seasonal ranges. This was most acute in the calving range where density increased 8-fold, from 1.5 to 12.0 animals km-2. Concurrent with increasing density, we documented range shifts and expansion across summer, post-calving and winter ranges. In particular, summer range size doubled (12,000 km2 increase) and overlap with core range (areas with repeated year-round use) was halved. Meanwhile, lichen cover, a key forage item, declined more in areas with high caribou density (2.4% absolute, 22% relative decline in cover) compared to areas where caribou were mostly absent (0.3% absolute, 1.9% relative decline). Conversely, deciduous shrub cover increased more in high caribou density areas. However, increases were dominated by less palatable shrubs whereas more palatable shrubs (i.e., willow [Salix spp.]) were stable or declined slightly. These changes in vegetation cover were small relative to uncertainty in the map products used to calculate change. Nonetheless, correlations between vegetation change and caribou range characteristics, along with concerning demographic trends reported over this same period, suggest changing forage conditions may have played a role in the herd's subsequent population decline. Our research highlights the potential of remotely sensed metrics of vegetation change for assessing the impacts of herbivory and trampling and stresses the importance of in situ data such as exclosures for validating such findings.
Keywords: Fortymile Caribou Herd; Rangifer tarandus; caribou; climate change; density dependence; forage; herbivory; range expansion; remote sensing; shrub expansion; vegetation change.
© 2025 His Majesty the King in Right of Canada and The Author(s). Ecological Applications published by Wiley Periodicals LLC on behalf of The Ecological Society of America. Reproduced with the permission of the Minister of Environment. This article has been contributed to by U.S. Government employees and their work is in the public domain in the USA.
Conflict of interest statement
The authors declare no conflicts of interest.
Figures
Similar articles
-
Behavioral responses of migratory caribou to semi-permeable roads in Arctic Alaska.Sci Rep. 2025 Jul 9;15(1):24712. doi: 10.1038/s41598-025-10216-6. Sci Rep. 2025. PMID: 40634430 Free PMC article.
-
Evaluating the impact of land use and land cover change on soil moisture variability using GIS and remote sensing technology in southwestern Ethiopia.Environ Monit Assess. 2025 Jun 30;197(7):824. doi: 10.1007/s10661-025-14301-1. Environ Monit Assess. 2025. PMID: 40586834
-
Environmental drivers of productivity explain population patterns of an Arctic-nesting bird across a half-century.Ecol Appl. 2025 Jul;35(5):e70067. doi: 10.1002/eap.70067. Ecol Appl. 2025. PMID: 40611677 Free PMC article.
-
Assessing the comparative effects of interventions in COPD: a tutorial on network meta-analysis for clinicians.Respir Res. 2024 Dec 21;25(1):438. doi: 10.1186/s12931-024-03056-x. Respir Res. 2024. PMID: 39709425 Free PMC article. Review.
-
A scoping review of tropical pioneer trees' roles for restoration and conservation management: Harungana madagascariensis (Hypericaceae) a widespread African species as a model.PeerJ. 2025 May 23;13:e19458. doi: 10.7717/peerj.19458. eCollection 2025. PeerJ. 2025. PMID: 40421372 Free PMC article.
References
-
- Barthelemy, H. , Stark S., and Olofsson J.. 2015. “Strong Responses of Subarctic Plant Communities to Long‐Term Reindeer Feces Manipulation.” Ecosystems 18: 740–751.
-
- Bernes, C. , Bråthen K. A., Forbes B. C., Speed J. D. M., and Moen J.. 2015. “What Are the Impacts of Reindeer/Caribou (Rangifer tarandus L.) on Arctic and Alpine Vegetation? A systematic review.” Environmental Evidence 4: 1–26.
-
- Biuw, M. , Jepsen J. U., Cohen J., Ahonen S. H., Tejesvi M., Aikio S., Wäli P. R., et al. 2014. “Long‐Term Impacts of Contrasting Management of Large Ungulates in the Arctic Tundra‐Forest Ecotone: Ecosystem Structure and Climate Feedback.” Ecosystems 17: 890–905.
MeSH terms
Grants and funding
LinkOut - more resources
Full Text Sources
Medical
Research Materials
Miscellaneous
