

The Role of Iron Homeostasis Imbalance in T2DM-Associated Cognitive Dysfunction: A Prospective Cohort Study Utilizing Quantitative Susceptibility Mapping
- PMID: 40530831
- PMCID: PMC12175199
- DOI: 10.1002/hbm.70263
The Role of Iron Homeostasis Imbalance in T2DM-Associated Cognitive Dysfunction: A Prospective Cohort Study Utilizing Quantitative Susceptibility Mapping
Abstract
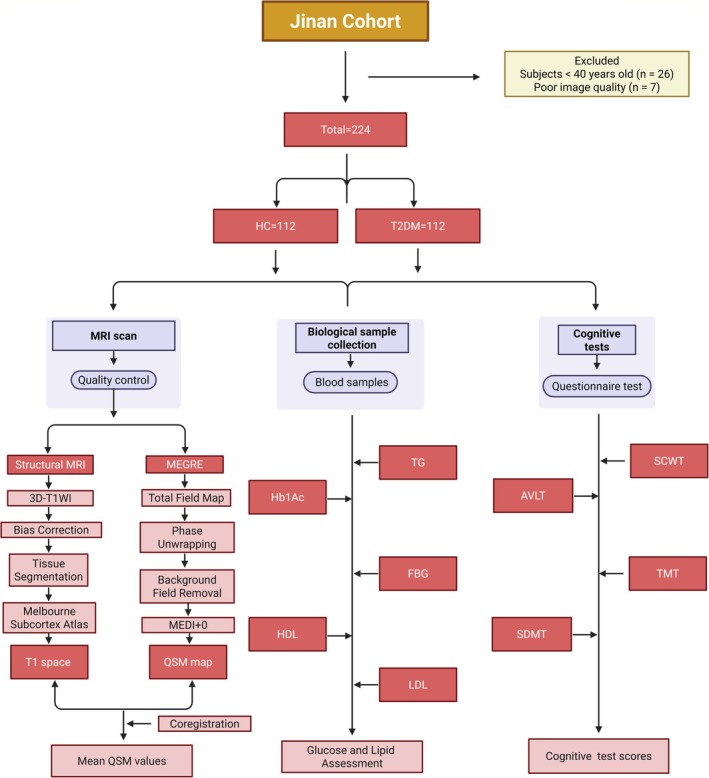
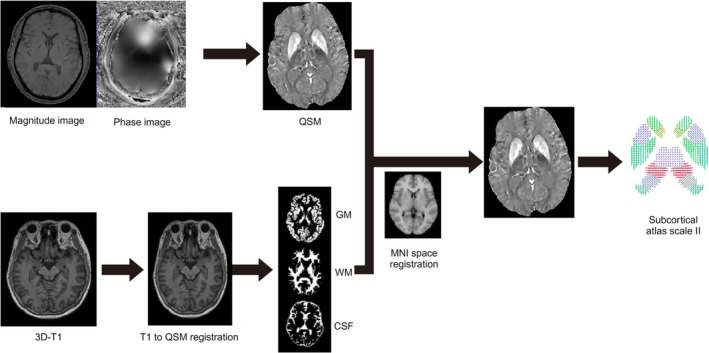
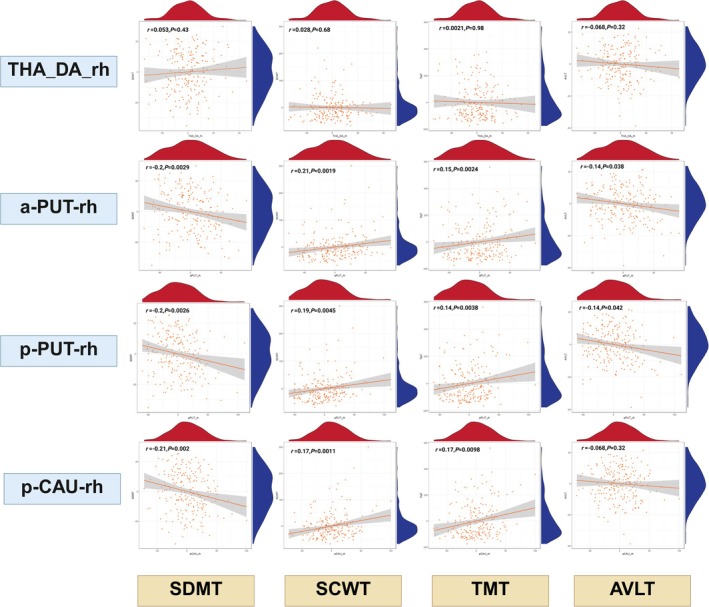
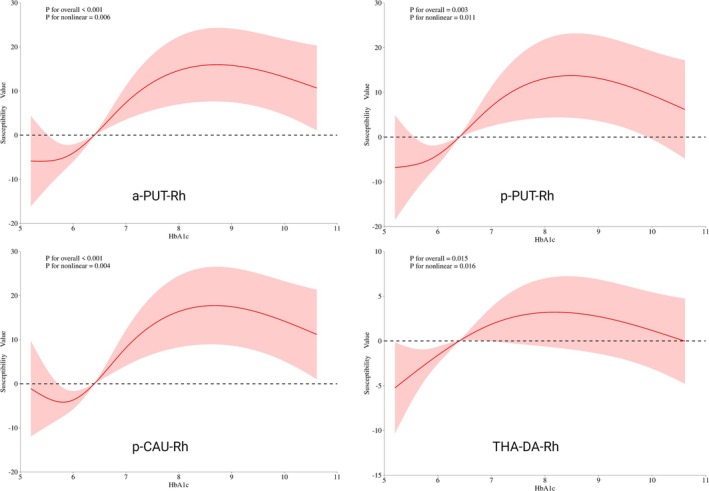
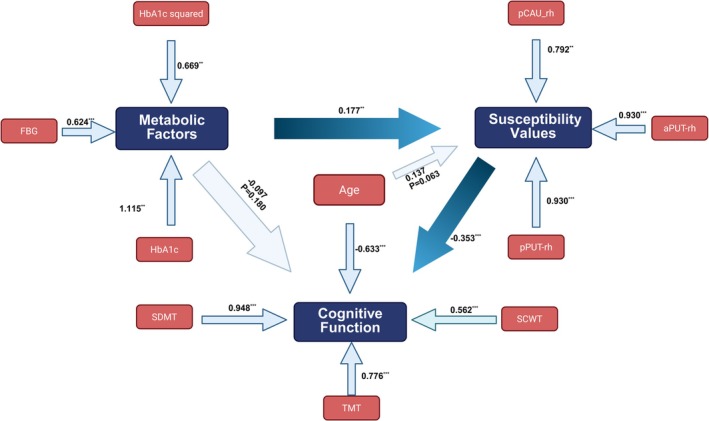
Type 2 diabetes mellitus (T2DM) is a chronic metabolic disorder that significantly impacts cognitive health. Although the vascular complications of T2DM have been extensively studied, research on brain iron deposition in T2DM remains scarce, and few studies have directly linked iron accumulation in cognition-related subcortical nuclei to cognitive dysfunction. This study aims to evaluate brain iron deposition using quantitative susceptibility mapping (QSM) and identify key subcortical nuclei associated with T2DM-related cognitive decline. A total of 224 participants were recruited, including 112 T2DM patients and 112 healthy controls. QSM was used to assess iron deposition in subcortical nuclei. Structural equation modeling was employed to construct interaction models between metabolic changes, susceptibility values, and cognitive function. Additionally, polynomial regression analysis was performed to evaluate the association between glycemic variability and the QSM values of subcortical nuclei. Our findings confirmed that T2DM patients exhibited pronounced iron deposition in the caudate and putamen compared to healthy controls. Correlation analyses showed that higher QSM values in the anterior putamen, posterior putamen, and posterior caudate were associated with slower processing speed (SDMT), reduced memory performance (AVLT) and poorer executive function (TMT, SCWT), indicating that greater iron accumulation in these nuclei is associated with poorer cognitive performance. In our SEM, metabolic dysregulation was significantly associated with higher subcortical susceptibility (β = 0.224, p = 0.010). The model further demonstrated that susceptibility values partially mediated the effect of metabolic factors on cognition (indirect effect β = -0.056, p = 0.018) and that the overall impact of metabolic dysregulation on cognition remained significant (β = -0.142, p = 0.037). Polynomial regression found that HbA1c was the strongest predictor of anterior putamen susceptibility, and a similar pattern was observed in the posterior caudate. The study demonstrates that the role of brain iron deposition in T2DM-related cognitive dysfunction. These findings reveal an important underlying mechanism of T2DM-induced cognitive impairment and provide evidence for early intervention strategies to mitigate cognitive decline in T2DM patients.
Keywords: cognitive dysfunction; iron deposition; quantitative susceptibility mapping; subcortical nuclei; type 2 diabetes.
© 2025 The Author(s). Human Brain Mapping published by Wiley Periodicals LLC.
Conflict of interest statement
The authors declare no conflicts of interest.
Figures
References
-
- Ahmed, M. , Chen J., Arani A., et al. 2023. “The Diamagnetic Component Map From Quantitative Susceptibility Mapping (QSM) Source Separation Reveals Pathological Alteration in Alzheimer's Disease‐Driven Neurodegeneration.” NeuroImage 280: 120357. - PubMed
-
- Apostolakis, S. , and Kypraiou A.‐M.. 2017. “Iron in Neurodegenerative Disorders: Being in the Wrong Place at the Wrong Time?” Reviews in the Neurosciences 28: 893–911. - PubMed
-
- Banks, W. A. 2020. “The Blood‐Brain Barrier Interface in Diabetes Mellitus: Dysfunctions, Mechanisms and Approaches to Treatment.” Current Pharmaceutical Design 26: 1438–1447. - PubMed
MeSH terms
Substances
Grants and funding
- 82272072/National Natural Science Foundation of China
- 202309010557/Medical and Health Science and Technology Development Project of Shandong Province
- 202309010560/Medical and Health Science and Technology Development Project of Shandong Province
- 202409010479/Medical and Health Science and Technology Development Project of Shandong Province
- 202328066/Technology Development Plan of Jinan
- ZR2020MH288/Natural Science Foundation of Shandong Province
- ZR2024MH026/Natural Science Foundation of Shandong Province
- SDYWZGKCIH2023034/Shandong Province Medical System Employee Science and Technology Innovation Plan
- SDYWZGKCJH2024021/Shandong Province Medical System Employee Science and Technology Innovation Plan
- 201803059/Funding for Study Abroad Program by Shandong Province
LinkOut - more resources
Full Text Sources
Medical
