

PDGF-D Promotes Epithelial-Mesenchymal Transition of Glioma Cells Through the NF-κB/NOTCH1 Pathway
- PMID: 40530904
- PMCID: PMC12175480
- DOI: 10.1002/cam4.71002
PDGF-D Promotes Epithelial-Mesenchymal Transition of Glioma Cells Through the NF-κB/NOTCH1 Pathway
Abstract
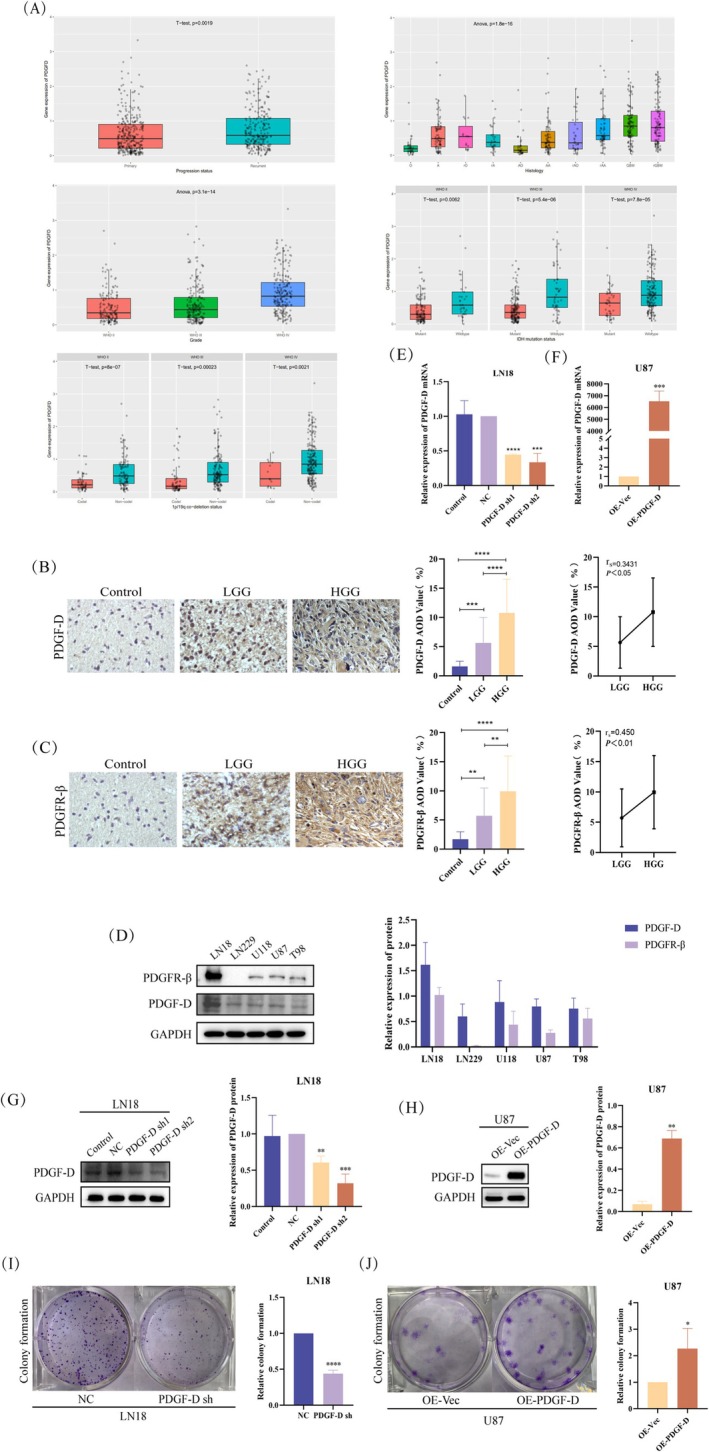
Background: Platelet-derived growth factor-D (PDGF-D) is expressed at high levels in various tumors and is involved in epithelial-mesenchymal transition (EMT) and the malignant behavior of cancer cells. However, its role in glioma progression and the underlying molecular mechanisms remain unclear.
Methods: We used data from the Chinese Glioma Genome Atlas to evaluate the correlation among PDGF-D expression, tumor grade, and phenotype of glioma. The in situ expression of PDGF-D in clinical glioma specimens was analyzed through immunohistochemistry. Colony formation assays and transwell assays were performed for functional evaluation of glioma cell lines with PDGF-D knockdown or overexpression. Western blotting and RT-qPCR were conducted to explore molecular mechanisms.
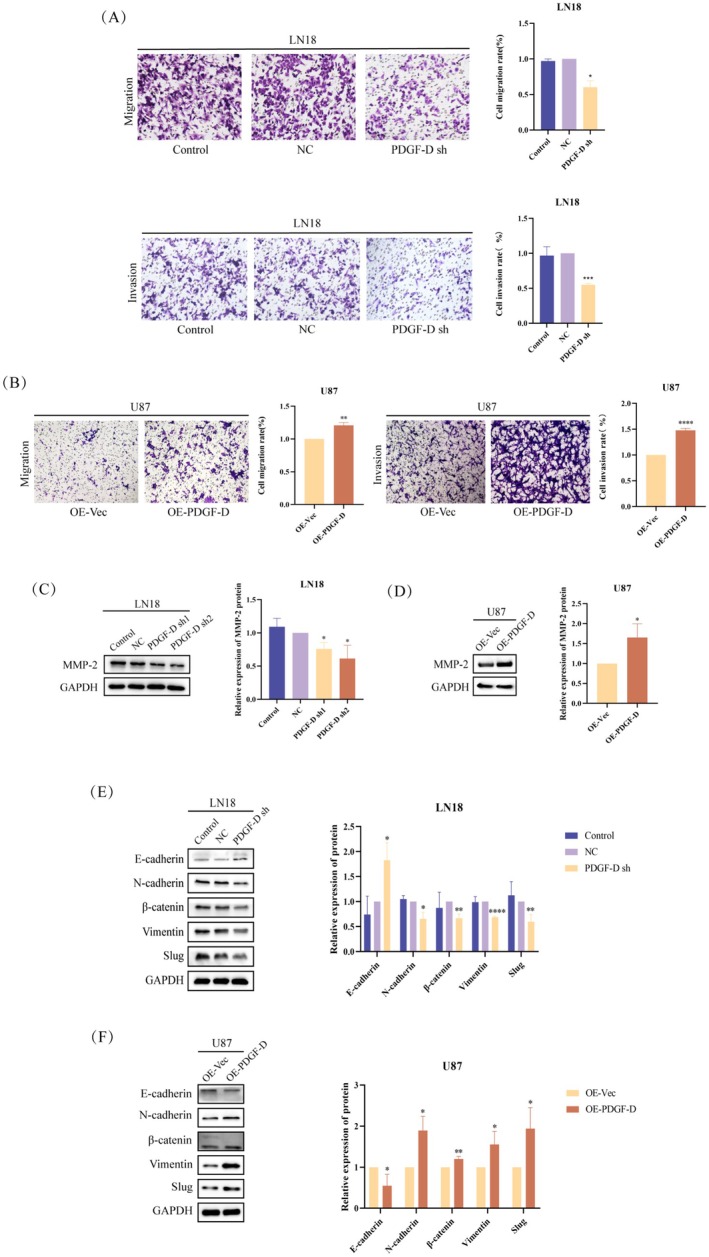
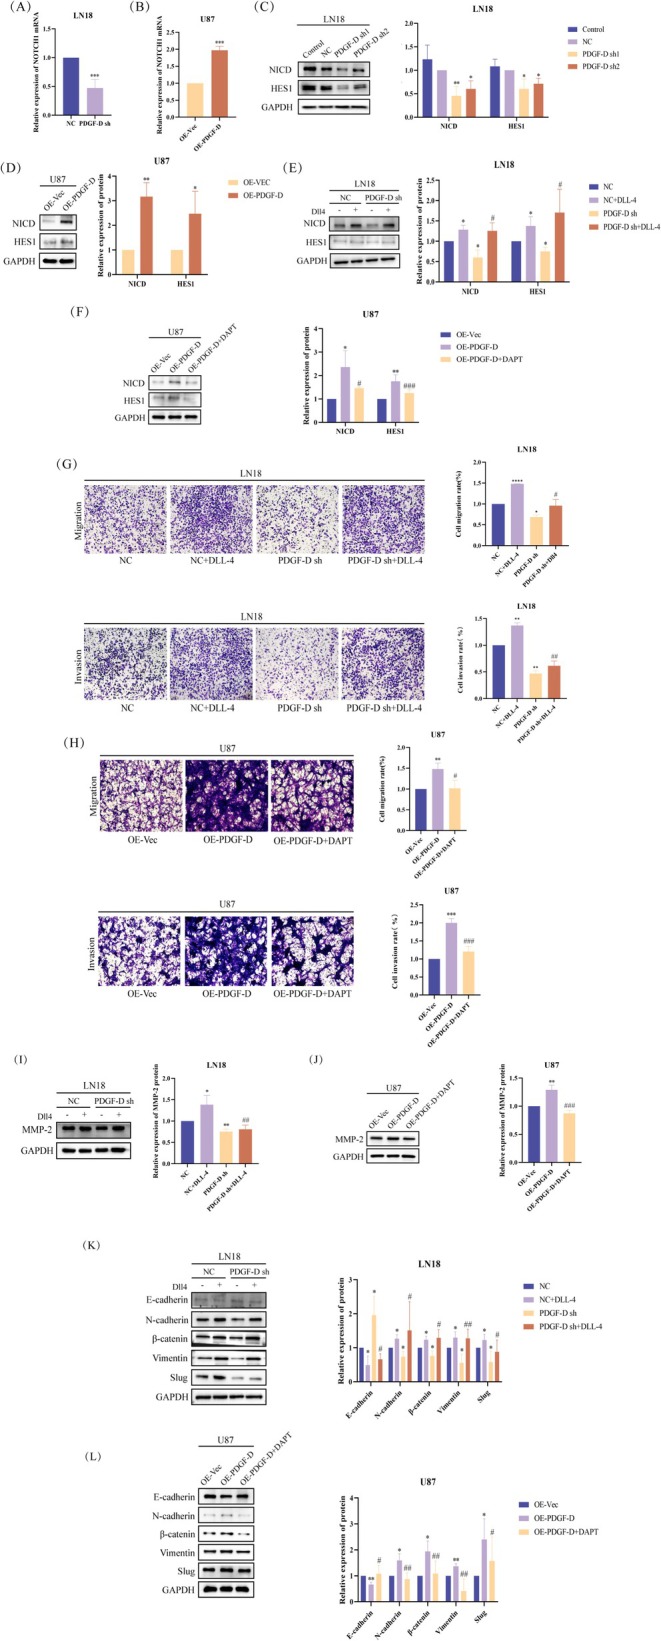
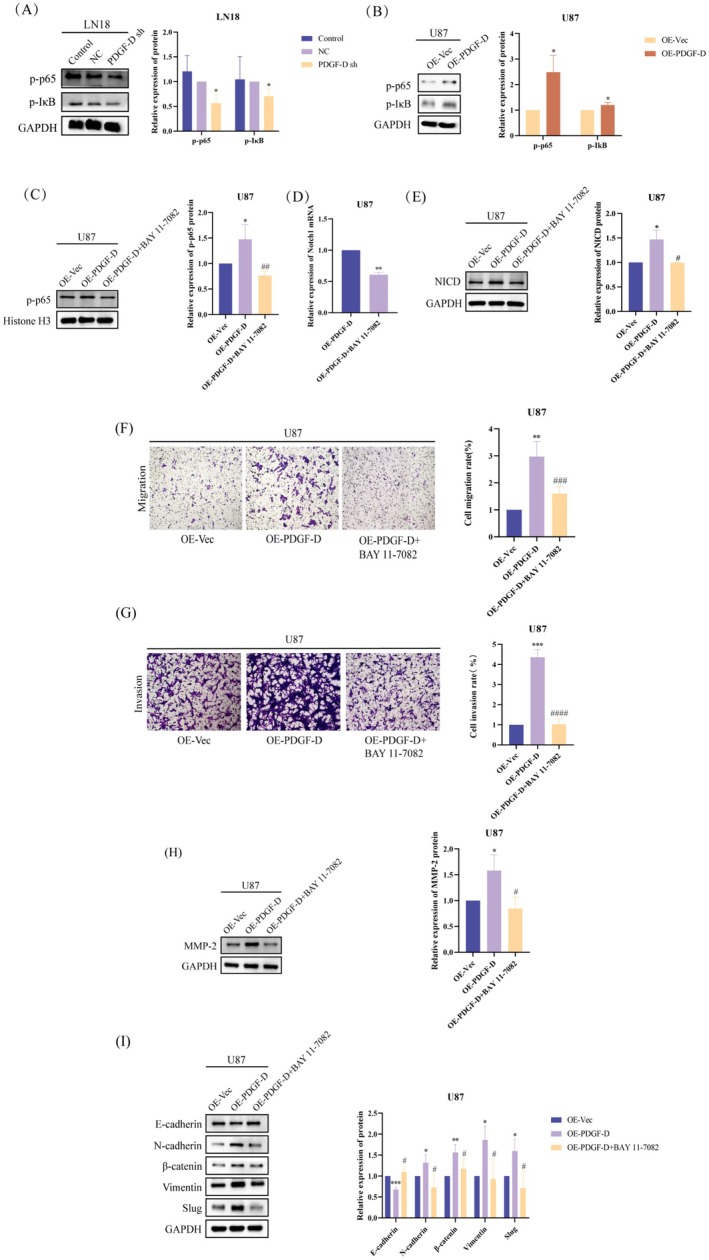
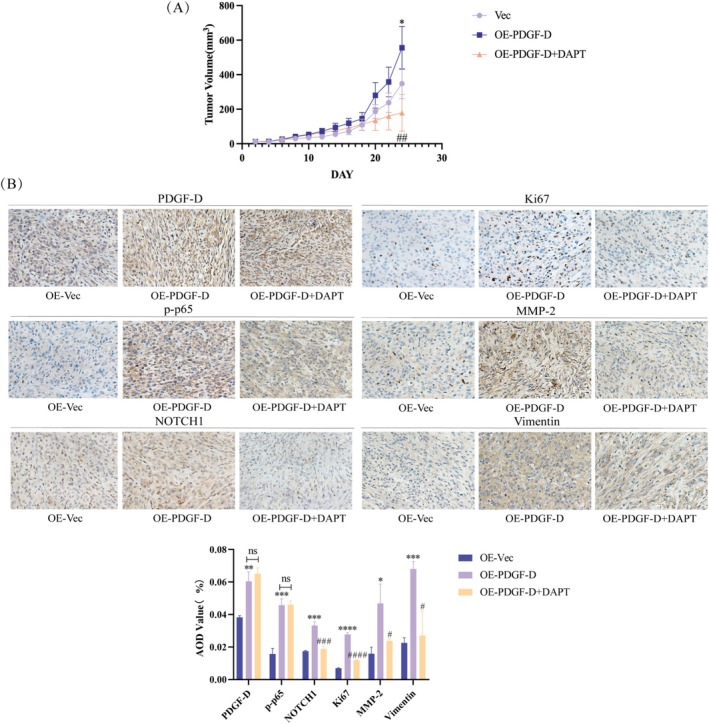
Results: PDGF-D was significantly upregulated in high-grade glioma and was associated with the malignant phenotype and poor prognosis. Knocking down PDGF-D in the LN18 glioma cell line reduced the expression of phosphorylated p65 and NOTCH1 and inhibited clonal proliferation, migration, invasion, and the EMT program. In contrast, inhibiting p65 phosphorylation in glioma cells overexpressing PDGF-D led to the downregulation of NOTCH1 and reversed EMT.
Conclusion: PDGF-D promotes the invasion and migration of glioma cells by activating the NF-κB/NOTCH1 pathway.
Keywords: EMT; NF‐κB; NOTCH1; PDGF‐D; glioma.
© 2025 The Author(s). Cancer Medicine published by John Wiley & Sons Ltd.
Conflict of interest statement
Clinical Perspectives: PDGF‐D regulates the migration, invasion, and EMT of a variety of tumor cells, but its role in glioma, a malignancy with a very poor prognosis, is not completely clear. Our results confirm that PDGF‐D is highly expressed in glioma tissues and correlates with the malignant phenotype and poor prognosis. It promotes EMT, migration, and invasive behavior of glioma cells by activating the NF‐κB/NOTCH1 pathway, which can potentially offer therapeutic targets for the development of new drugs.
Animal Studies: The study was approved by the Ethics Committees of The First Hospital of Jilin University (20230637–29/08/2023).
The authors declare no conflicts of interest.
Figures
Similar articles
-
Pleiotrophin promote glioma proliferation and invasion by enhancing NF-κB/SLUG mediated epithelial-mesenchymal transition.Eur J Med Res. 2025 Jul 2;30(1):545. doi: 10.1186/s40001-025-02808-9. Eur J Med Res. 2025. PMID: 40604866 Free PMC article.
-
CCN1 Promotes Mesenchymal Phenotype Transition Through Activating NF-κB Signaling Pathway Regulated by S100A8 in Glioma Stem Cells.CNS Neurosci Ther. 2024 Dec;30(12):e70128. doi: 10.1111/cns.70128. CNS Neurosci Ther. 2024. PMID: 39659236 Free PMC article.
-
CSRP2 promotes the glioblastoma mesenchymal phenotype via p130Cas-mediated NF-κB and MAPK pathways.J Exp Clin Cancer Res. 2025 Aug 5;44(1):228. doi: 10.1186/s13046-025-03484-7. J Exp Clin Cancer Res. 2025. PMID: 40764945 Free PMC article.
-
P2X7R: A Critical Regulator and Potential Therapeutic Target for Glioma.J Neurosci Res. 2025 Jul;103(7):e70065. doi: 10.1002/jnr.70065. J Neurosci Res. 2025. PMID: 40607594 Review.
-
Emerging roles of PDGF-D in EMT progression during tumorigenesis.Cancer Treat Rev. 2013 Oct;39(6):640-6. doi: 10.1016/j.ctrv.2012.11.006. Epub 2012 Dec 20. Cancer Treat Rev. 2013. PMID: 23261166 Free PMC article. Review.
References
-
- Wang L. M., Englander Z. K., Miller M. L., et al., “Malignant Glioma,” Advances in Experimental Medicine and Biology 1405 (2023): 1–30. - PubMed
-
- Fabian C., Han M., Bjerk vig R., et al., “Novel Facets of Glioma Invasion,” International Review of Cell and Molecular Biology 360 (2021): 33–64. - PubMed
-
- Louis D. N., Perry A., Reifenberger G., et al., “The 2016 World Health Organization Classification of Tumors of the Central Nervous System: A Summary,” Acta Neuropathologica 131, no. 6 (2016): 803–820. - PubMed
-
- Jonckheere S., Adams J., Groote D., Campbell K., Berx G., and Goossens S., “Epithelial‐Mesenchymal Transition (EMT) as a Therapeutic Target,” Cells, Tissues, Organs 211, no. 2 (2022): 157–182. - PubMed
MeSH terms
Substances
Grants and funding
LinkOut - more resources
Full Text Sources
Medical
