

Associations Between Myopia and Brain Volumes: An Observational and Genetic Analysis
- PMID: 40530922
- PMCID: PMC12180605
- DOI: 10.1167/iovs.66.6.57
Associations Between Myopia and Brain Volumes: An Observational and Genetic Analysis
Abstract
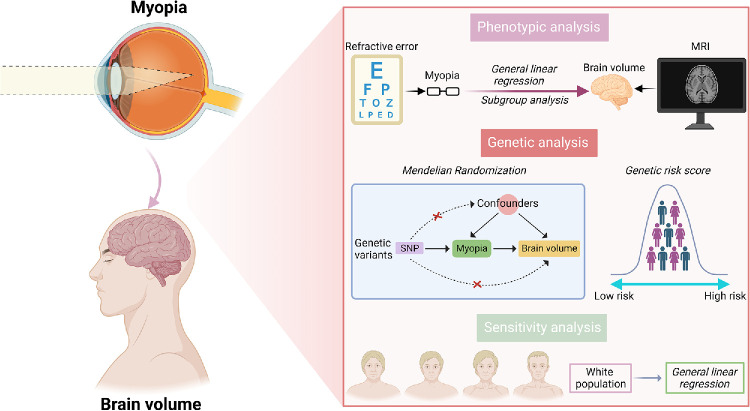
Purpose: To examine phenotypic and genetic associations between myopia and various brain volumes using the UK Biobank database.
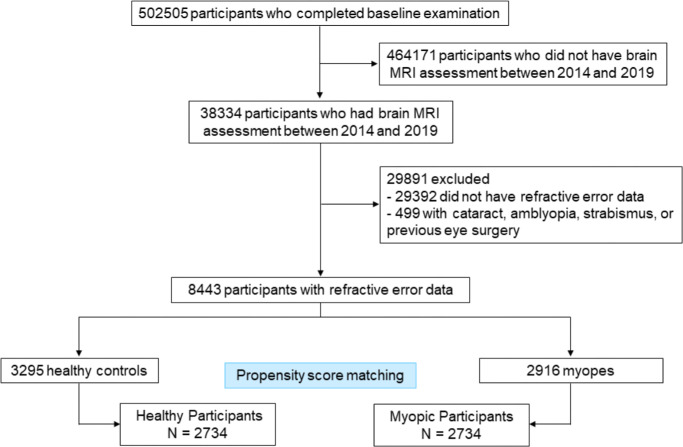
Methods: After 1:1 propensity score matching (PSM) between participants with myopia and healthy controls, the relationship between myopia and brain volumes was examined using general linear regression, with adjustments for covariates including age, sex, ethnicity, Townsend Deprivation Index, lifestyle factors, and disease status. Bonferroni correction was applied for multiple comparisons. Bidirectional Mendelian randomization (MR) and genetic risk score (GRS) were used to assess genetic associations.
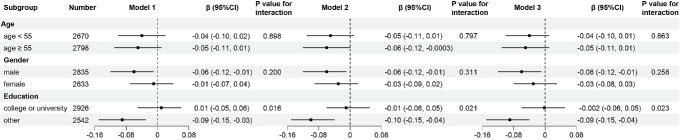
Results: After Bonferroni correction, general linear regression revealed that myopia was significantly associated with reduced total brain volume (β, -0.07 mL; 95% confidence interval [CI], -0.11 to -0.03) and white matter volume (β, -0.08 mL; 95% CI, -0.13 to -0.03) in the fully adjusted model. Education significantly modified the myopia-gray matter association, with a stronger negative correlation in individuals without a college education (β, -0.09 mL; 95% CI, -0.15 to -0.04). MR analysis indicated no obvious causal effect of myopia on brain volumes, and GRS analysis revealed only a slight decreasing trend in total brain volume with increasing genetic risk for myopia (P value for trend < 0.05).
Conclusions: Although myopia shows phenotypic associations with brain volumes, including total brain and white matter, and particularly with gray matter in individuals with lower education, genetic analysis (MR and GRS) did not support a causal or genetic link with brain volumes. These findings suggest that residual confounding factors beyond education level may underlie the observed associations between myopia and brain volumes, underscoring the need for further research to elucidate these relationships.
Conflict of interest statement
Disclosure:
Figures
Similar articles
-
Bidirectional Causal Relationship Between Myopia and Neurodegenerative Diseases: Two-Sample Mendelian Randomization Analyses.Br J Hosp Med (Lond). 2025 Jun 25;86(6):1-19. doi: 10.12968/hmed.2025.0183. Epub 2025 Jun 18. Br J Hosp Med (Lond). 2025. PMID: 40554439
-
Cost-effectiveness of using prognostic information to select women with breast cancer for adjuvant systemic therapy.Health Technol Assess. 2006 Sep;10(34):iii-iv, ix-xi, 1-204. doi: 10.3310/hta10340. Health Technol Assess. 2006. PMID: 16959170
-
Associations of Central Arterial Stiffness With Brain White Matter Integrity and Gray Matter Volume in MRI Across the Adult Lifespan.J Magn Reson Imaging. 2025 Jul;62(1):215-229. doi: 10.1002/jmri.29713. Epub 2025 Jan 10. J Magn Reson Imaging. 2025. PMID: 39792583 Free PMC article.
-
Magnetic resonance perfusion for differentiating low-grade from high-grade gliomas at first presentation.Cochrane Database Syst Rev. 2018 Jan 22;1(1):CD011551. doi: 10.1002/14651858.CD011551.pub2. Cochrane Database Syst Rev. 2018. PMID: 29357120 Free PMC article.
-
Intravenous magnesium sulphate and sotalol for prevention of atrial fibrillation after coronary artery bypass surgery: a systematic review and economic evaluation.Health Technol Assess. 2008 Jun;12(28):iii-iv, ix-95. doi: 10.3310/hta12280. Health Technol Assess. 2008. PMID: 18547499
Cited by
-
The neural signature of high myopia: structural and functional brain alterations and their cognitive-emotional associations.Front Cell Dev Biol. 2025 Aug 5;13:1634553. doi: 10.3389/fcell.2025.1634553. eCollection 2025. Front Cell Dev Biol. 2025. PMID: 40837193 Free PMC article. Review.
References
Publication types
MeSH terms
LinkOut - more resources
Full Text Sources
Miscellaneous
