. 2025 Aug 1;82(8):778-789.
doi: 10.1001/jamapsychiatry.2025.1246.

Framework for Brain-Derived Dimensions of Psychopathology

Collaborators, Affiliations

Framework for Brain-Derived Dimensions of Psychopathology

Tristram A Lett et al. JAMA Psychiatry. .

Abstract

Importance: Psychiatric diagnoses are not defined by neurobiological measures hindering the development of therapies targeting mechanisms underlying mental illness. Research confined to diagnostic boundaries yields heterogeneous biological results, whereas transdiagnostic studies often investigate individual symptoms in isolation.

Objective: To develop a framework that groups clinical symptoms compatible with ICD-10 and DSM-5 according to their covariation and shared brain mechanisms.

Design, setting, and participants: This diagnostic study was conducted in 2 samples, the population-based Reinforcement-Related Behaviour in Normal Brain Function and Psychopathology (IMAGEN) cohort (longitudinal assessments at 14, 19, and 23 years; study duration from March 2010 to the present) and the cross-diagnostic Brain Network Based Stratification of Mental Illness (STRATIFY)/Earlier Detection and Stratification of Eating Disorders and Comorbid Mental Illnesses (ESTRA) samples (study duration from October 2016 to September 2023). The samples are from 8 clinical research hospitals in Germany, the UK, France, and Ireland. For the population-based IMAGEN study, 794 of 1253 23-year-old participants had complete assessments including complete clinical assessments and neuroimaging data across all time points. For the cross-diagnostic STRATIFY/ESTRA samples, 209 of 485 participants aged 18 to 26 years had complete clinical and neuroimaging data. The sample included healthy control individuals and patients with alcohol use disorder, major depressive disorder, anorexia nervosa, and bulimia nervosa.

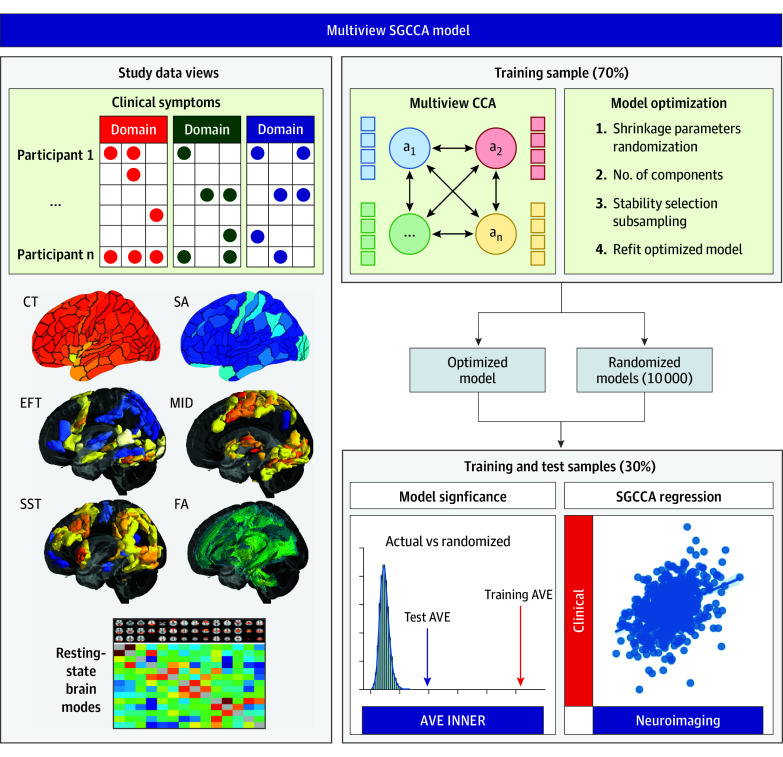
Exposures: Sparse generalized canonical correlation analysis was used to integrate diverse data from clinical symptoms and 7 brain imaging modalities.

Main outcomes and measures: The prediction of symptom features was the main outcome. The model was developed in the training set from the IMAGEN Study at age 23 years (70%), then applied in the remaining holdout test sample (30%), the independent STRATIFY/ESTRA patient sample, and longitudinally in the IMAGEN set.

Results: In total, 1003 participants were included (425 male and 578 female; mean [SD] age, 22.1 [1.5] years). The reassembly of existing ICD-10 and DSM-5 symptoms revealed 6 cross-diagnostic psychopathology scores. They were consistently associated with multimodal neuroimaging components: excitability and impulsivity (training set: r, 0.26; 95% CI, 0.18-0.33; test set: r, 0.22; 95% CI, 0.10-0.35; STRATIFY/ESTRA set: r, 0.19; 95% CI, 0.07-0.31), depressive mood and distress (training: r, 0.30; 95% CI, 0.20-0.38; test: r, 0.22; 95% CI, 0.09-0.35; STRATIFY/ESTRA: r, 0.19; 95% CI, 0.04-0.33), emotional and behavioral dysregulation (training: r, 0.40; 95% CI, 0.31-0.48; test: r, 0.17; 95% CI, 0.14-0.36; STRATIFY/ESTRA: r, 0.19; 95% CI, 0.06-0.30), stress pathology (training: r, 0.32; 95% CI, 0.19-0.43; test: r, 0.14; 95% CI, 0.05-0.23; STRATIFY/ESTRA: r, 0.12; 95% CI, 0.01-0.22), eating pathology (training: r, 0.34; 95% CI, 0.25-0.42; test: r, 0.26; 95% CI, 0.15-0.37; STRATIFY/ESTRA: r, 0.15; 95% CI, 0.12-0.34), and social fear and avoidance symptoms (training: r, 0.31; 95% CI, 0.25-0.42; test: r, 0.18; 95% CI, 0.15-0.35; STRATIFY/ESTRA: r, 0.12; 95% CI, 0.12-0.33).

Conclusion and relevance: In this study, the identification of symptom groups of mental illness robustly defined by precisely characterized brain mechanisms enabled the characterization of dimensions of psychopathology based on quantifiable neurobiological measures.


Conflict of interest statement

Conflict of Interest Disclosures: Dr Banaschewski reported personal fees from AGB pharma, Eye Level, Infectopharm, Medice, Janssen-Cilag, Neurim Pharmaceuticals, Oberberg, Takeda, Hogrefe, Kohlhammer, CIP Medien, and Oxford University Press outside the submitted work. Dr Bokde reported grants from European Research Council Advanced during the conduct of the study and from National Children’s Hospital Foundation and Health Research Board outside the submitted work. Dr Gowland reported grants from the European Union and Medical Research Council during the conduct of the study and from Engineering & Physical Sciences Research Council, Nestle, Cystic Fibrosis Trust, Wellcome Leap, Defence Science and Technology Laboratory, Leo Cancer Care, Medical Research Council, and Biomedical Research Centre outside the submitted work and is a local councilor. Dr Poustka reported speaker fees from Takeda, royalties from Hogrefe, and grants from German Research Foundation and German Ministry of Education and Research outside the submitted work. Dr Z. Zhang reported grants from Medical Research Foundation during the conduct of the study. Dr Smolka reported grants from Deutsche Forschungsgemeinschaft during the conduct of the study. Dr Robbins reported consultancy fees from Cambridge Cognition, grants from Shionogi, consultancy fees to department from Supenus, and editorial honoraria from Springer Nature and Elsevier outside the submitted work. Dr Desrivieres reported grants from Medical Research Council, Medical Research Foundation, and UK Research and Innovation during the conduct of the study and from the National Institute of Aging outside the submitted work. Dr Marquand reported serving as senior editor at eLife and receiving speaker honoraria from Wiegerink outside the submitted work. Dr Schumann reported grants from European Union-funded Horizon Europe, UK Research and Innovation, the Horizon 2020-funded European Research Council Advanced, and the Human Brain Project during the conduct of the study. No other disclosures were reported.

Figures

Figure 1.
Figure 1.. Development of the Sparse Generalized Canonical Correlation Analysis (SGCCA) Model in the Reinforcement-Related Behaviour in Normal Brain Function and Psychopathology (IMAGEN) Study
The SGCCA model incorporates 8 distinct datasets (called data views), consisting of both clinical assessments and neuroimaging modalities, from the IMAGEN study. This model is built using 70% of the participants as the training dataset, while the remaining 30% form the test group. The method used is canonical correlation analysis, which uses cross-covariance matrices of 2 or more sets of data views to identify linear combinations (or components) that have maximal correlation. The training data serve several crucial purposes: first, optimizing the model’s parameters, including shrinkage parameters (sparsity); second, determining the suitable number of components; and lastly, performing stability selection (for details, refer to the eMethods in Supplement 1). After establishing the optimal model parameters, the training data are refitted accordingly. Furthermore, 10 000 randomized models are generated by permuting participants among each training data view. This allows us to evaluate the significance of the model within both the training and test datasets for each component. In the training data, the inner average variance explained (AVE) of the actual model is ranked and compared to the inner AVE of the randomized models. Similarly, the test data are fitted to both the actual and randomized models, and their inner AVEs are compared. Last, regression of the data view components is conducted, with clinical component scores as dependent variables and neuroimaging scores as independent variables. This entire process is repeated in both the training and test samples for each of the significant components. CCA indicates canonical correlation analysis; CT, cortical thickness; EFT, emotional face task; FA, fractional anisotropy; MID, monetary incentive delay task; SA, surface area; SST, stop-signal task.
Figure 2.
Figure 2.. Aggregated Loadings for the Development and Well-Being Assessment (DAWBA) Sections and Alcohol Use Disorders Identification Test (AUDIT) Questionnaire
The aggregate loading (radial axis) provides an overview of the association between the symptom scores and the clinical items for the Reinforcement-Related Behaviour in Normal Brain Function and Psychopathology (IMAGEN) training and test samples and the Brain Network Based Stratification of Mental Illness (STRATIFY)/Earlier Detection and Stratification of Eating Disorders and Comorbid Mental Illnesses (ESTRA) sample. The aggregated loading represents the mean of the AUDIT and DAWBA sections for the correlation between the psychopathology scores on the original clinical items. ADHD indicates attention-deficit/hyperactivity disorder; AUD, alcohol use disorder; BPD, bipolar disorder; ED, eating disorders; GAD, generalized anxiety disorder; MDD, major depressive disorder; OCD, obsessive-compulsive disorder; POS, positivity, PSY, psychosis; PTSD, posttraumatic stress disorder.
Figure 3.
Figure 3.. Clinical Contribution to Each Psychopathology Component
The top 25 clinical structural coefficients are plotted according to their absolute value for each psychopathology component. The question from the clinical battery is on the y-axis with its corresponding section in parentheses, and the structural coefficients are on the x-axis. All items are significant (false discovery rate–corrected P < .05) after 10 000 bootstraps. ADHD indicates attention-deficit/hyperactivity disorder; AUDIT, alcohol use disorders identification test; BPD, bipolar disorder; ED, eating disorder; GAD, general anxiety disorder; MDD, major depressive disorder. OCD, obsessive compulsive disorder; PanAttack, panic attack; PTSD, posttraumatic stress disorder; SDQ, Strength and Difficulties Questionnaire; SocFear, social fears.
Figure 4.
Figure 4.. Contribution of Neuroimaging Features to the Psychopathology Symptoms for Each Significant Component
Sparse Generalized Canonical Correlation Analysis (SGCCA)–regression of the variates for the training, test Reinforcement-Related Behaviour in Normal Brain Function and Psychopathology (IMAGEN) samples, and Brain Network Based Stratification of Mental Illness (STRATIFY)/Earlier Detection and Stratification of Eating Disorders and Comorbid Mental Illnesses (ESTRA) sample with the psychopathology scores as the response variable and the neuroimaging predictor scores for: the emotional face task, the monetary incentive delay task, the stop-signal task, cortical thickness, surface area, the resting-state brain modes connectivity, and white matter fractional anisotropy. A, Regression model fit and 95% CIs with variate psychopathology scores as the response variable and the neuroimaging predictor scores for the emotional face task, the monetary incentive delay task, the stop-signal task, cortical thickness, surface area, the resting-state brain modes connectivity, and white matter fractional anisotropy. B, Bar charts of the model coefficients. Each regression model underwent 10 000 bootstraps to determine the confidence interval and significance. The horizontal line represents the 95% CI. aBootstrapped P < .05. bBootstrapped P < .008.
Figure 5.
Figure 5.. Neuroimaging Loadings for Each Psychopathology Score
Significant loadings (structural coefficient r) for each score are shown using 10 000 bootstraps and after accounting for false discovery rate –adjusted P < .05. Colors ranging from red to dark blue denote significant positive and negative r values, respectively. The psychopathology components of interest were excitability and impulsivity (stop-signal task and surface area), depressive mood and distress (monetary incentive delay task and stop-signal task), emotional and behavioral dysregulation (emotional face task, stop-signal task, and monetary incentive delay task), stress pathology (monetary incentive delay task), eating pathology (monetary incentive delay task and resting-state functional magnetic resonance imaging [fMRI] brain modes), and social fear and avoidance (resting-state fMRI brain modes). DMN indicates default mode network; ECN, executive control network.

References

    1. Insel TR, Cuthbert BN. Medicine. brain disorders? precisely. Science. 2015;348(6234):499-500. doi: 10.1126/science.aab2358 - DOI - PubMed
    1. Opel N, Goltermann J, Hermesdorf M, Berger K, Baune BT, Dannlowski U. Cross-disorder analysis of brain structural abnormalities in six major psychiatric disorders: a secondary analysis of mega- and meta-analytical findings from the ENIGMA Consortium. Biol Psychiatry. 2020;88(9):678-686. doi: 10.1016/j.biopsych.2020.04.027 - DOI - PubMed
    1. Sprooten E, Rasgon A, Goodman M, et al. Addressing reverse inference in psychiatric neuroimaging: Meta-analyses of task-related brain activation in common mental disorders. Hum Brain Mapp. 2017;38(4):1846-1864. doi: 10.1002/hbm.23486 - DOI - PMC - PubMed
    1. Chen CP, Keown CL, Jahedi A, et al. Diagnostic classification of intrinsic functional connectivity highlights somatosensory, default mode, and visual regions in autism. Neuroimage Clin. 2015;8:238-245. doi: 10.1016/j.nicl.2015.04.002 - DOI - PMC - PubMed
    1. Jia T, Ing A, Quinlan EB, et al. ; IMAGEN Consortium . Neurobehavioural characterisation and stratification of reinforcement-related behaviour. Nat Hum Behav. 2020;4(5):544-558. doi: 10.1038/s41562-020-0846-5 - DOI - PubMed