. 2025 Jun 20;11(25):eadu7898.
doi: 10.1126/sciadv.adu7898. Epub 2025 Jun 18.

Gating of hair cell Ca2+ channels governs the activity of cochlear neurons

Affiliations

Gating of hair cell Ca2+ channels governs the activity of cochlear neurons

Nare Karagulyan et al. Sci Adv. .

Abstract

Our sense of hearing processes sound intensities spanning six orders of magnitude. In the ear, the receptor potential of presynaptic inner hair cells (IHCs) covers the entire intensity range, while postsynaptic spiral ganglion neurons (SGNs) tile the range with their firing rate codes. IHCs vary the voltage dependence of Ca2+ channel activation among their active zones (AZs), potentially diversifying SGN firing. Here, we tested this hypothesis in mice modeling the human CaV1.3A749G mutation that causes low-voltage Ca2+ channel activation. We demonstrate activation of Ca2+ influx and glutamate release of IHC AZs at lower voltages, increased spontaneous firing in SGNs, and lower sound threshold of CaV1.3A749G/A749G mice. Loss of synaptic ribbons in IHCs at ambient sound levels of mouse husbandry indicates that low-voltage Ca2+ channel activation poses a risk for noise-induced synaptic damage. We propose that the heterogeneous voltage dependence of CaV1.3 activation among presynaptic IHC AZs contributes to the diversity of firing among the postsynaptic SGNs.


Figures
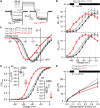
Fig. 1.
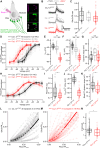
Fig. 1.. Shift to lower voltages and altered voltage sensitivity of CaV1.3 activation in IHCs of CaV1.3AG/WT and CaV1.3AG/AG mice.
(A) Representative Ca2+ current traces from CaV1.3WT/WT (bottom left) and CaV1.3AG/AG (bottom right) IHCs evoked by step depolarizations (top). (B) Whole-cell Ca2+ current-voltage relationships (I-V curves) show comparable maximal Ca2+ current amplitude in CaV1.3WT/WT, CaV1.3AG/WT, and CaV1.3AG/AG IHCs. Error bars show ± SEM. (C) Ca2+ channel activation–voltage relationships calculated from I-V curves show a hyperpolarized shift in CaV1.3AG/WT and CaV1.3AG/AG IHCs. Error bars show ± SEM. (Ca) The voltage of half-maximal activation (Vhalf) is hyperpolarized in CaV1.3AG/WT and CaV1.3AG/AG IHCs. (Cb) The voltage sensitivity (k) is decreased in CaV1.3AG/WT and increased in CaV1.3AG/AG IHCs compared to the controls. (D) Mean exocytic change in membrane capacitance (ΔCm) and Ca2+ current integrals (QCa) evoked by 100-ms pulses of different depolarizations. (E) Mean exocytic ΔCm in response to different depolarization durations. Data in (B) to (D) are presented as mean ± SEM. Box-whisker plots with individual data points overlaid show the median, 25th, and 75th percentiles (box) and 10th and 90th percentiles (whiskers). Statistical significances were determined using one-way analysis of variance (ANOVA), followed by Tukey’s post hoc test for (Ca) and (Cb). Significances are reported as **P < 0.01 and ***P < 0.001.
Fig. 2.
Fig. 2.. Reduced amplitude, hyperpolarized activation, and altered voltage sensitivity of synaptic Ca2+ influx in CaV1.3AG/AG IHCs.
(A) Single confocal plane of a representative CaV1.3WT/WT IHC showing TAMRA-conjugated dimeric Ribeye/Ctbp2 peptide and Fluo4-FF fluorescence. Scale bar, 2 μm. Black and gray colors of voltage ramp stimuli and corresponding whole-cell Ca2+ currents show IHC response to two voltage ramp depolarizations. Intensity-time profiles of single Ca2+ hotspots from one IHC are shown with different colors. bp, binding peptide; a.u., arbitrary units. (B) Average fluorescence-voltage (F-V) relationships of Ca2+ influx at single AZs of CaV1.3WT/WT and CaV1.3AG/AG IHCs. Shaded areas show ± SEM. (Ba) The maximal Ca2+ influx amplitude (ΔF/F0 max) at single AZs is reduced in IHCs of CaV1.3AG/AG mice. (C) Fractional activation curves of Ca2+ channels at individual AZs. Thick, dark lines show the averages, and lighter colors represent individual curves. (Ca and Cb) Box plots showing k (Ca) and Vhalf (Cb) of Ca2+ channels calculated from the Boltzmann fits in (C). (D) The spatial gradient of maximal Ca2+ influx is collapsed in CaV1.3AG/AG IHCs. n.s., not significant. (E) The spatial gradient of Vhalf is maintained in CaV1.3AG/AG IHCs. Polar plots in (D) and (E) show the positions of individual AZs in CaV1.3WT/WT (left) and CaV1.3AG/AG (right) IHCs. Pseudocolor scales represent maximal Ca2+ influx amplitude (D) and Vhalf (E). Box plots compare ΔF/F0 max (D) and Vhalf (E) at the pillar and modiolar AZs in IHCs of CaV1.3WT/WT and CaV1.3AG/AG mice. Data were acquired from N = 8 (CaV1.3WT/WT) and 6 (CaV1.3AG/AG) mice. Box-whisker plots with individual data points overlaid show the median, 25th, and 75th percentiles (box) and 10th and 90th percentiles (whiskers). Statistical significances were determined using two-tailed Wilcoxon rank sum test for data in (Ba), (Ca), (Cb), (D), and (E). Significances are reported as *P < 0.05, **P < 0.01, and ***P < 0.001.
Fig. 3.
Fig. 3.. Activation of glutamate release at IHC synapses occurs at lower voltages in CaV1.3AG mice.
(A) Average projection of ΔF images of Rhod-FF fluorescence from multiple planes of a representative CaV1.3WT/WT IHC (top). Average projection of ΔF images of iGluSnFR fluorescence from 50-ms depolarizations at a single IHC plane (middle). Scale bar, 5 μm. (B) Average ΔF/F0 traces of iGluSnFR fluorescence. Individual traces are in lighter colors. (C) Box plot showing ΔF/F0 max of iGluSnFR signal. (D) Voltage dependence of normalized iGluSnFR signal. Data from individual boutons are shown for CaV1.3WT/WT and CaV1.3AG/AG animals. (E to G) Box plots showing Vhalf (E), V10 (F), and dynamic range (G) of glutamate release. (H) Voltage dependence of normalized Ca2+ influx at single AZs. Individual traces are shown with lighter colors. Dotted lines show the average modified Boltzmann function fit. Thick lines show fits matching the voltage dependency range of iGluSnFR recordings. (I to K) Box plots showing ΔF/F0 max (I), Vhalf (J), and dynamic range (K) of Ca2+ influx. (L and M) Synaptic transfer function at single synapses in CaV1.3WT/WT (L) and CaV1.3AG/AG (M) IHCs. A thick, solid line shows the average. Dotted line represents the power function fitted to the first 25% of the glutamate release. (N) Box plot showing power (m) of Ca2+ influx–glutamate release. Data were acquired from N = 12 (CaV1.3WT/WT), 5 (CaV1.3AG/WT), and 9 (CaV1.3AG/AG) mice. Box-whisker plots with individual data points overlaid show the median, 25th, and 75th percentiles (box) and 10th and 90th percentiles (whiskers). Statistical significances were determined using the Kruskal-Wallis test for (C), one-way ANOVA followed by Tukey’s post hoc test for (E) and (F), Kruskal-Wallis followed by Dunn’s test for (G), two-tailed Wilcoxon rank sum test for (I) and (N), and two-tailed t test for (J) and (K). Significances are reported as *P < 0.05, **P < 0.01, and ***P < 0.001.
Fig. 4.
Fig. 4.. Increased spontaneous rates in SGNs of CaV1.3AG/WT and CaV1.3AG/AG mice.
(A) Average ABR waveforms in response to 80-dB clicks recorded in mice under urethane/xylazine anesthesia. Shaded areas show ± SEM. (B) ABR thresholds in response to click stimuli are lower in CaV1.3AG/AG mice compared to CaV1.3WT/WT littermates. SPL, sound pressure level. (C) ABR P1-N1 amplitude was significantly bigger in CaV1.3AG/AG at near-threshold stimulation [40 dB (peak equivalent)] but similar to CaV1.3WT/WT across other sound pressure levels. (D) SRs of SGNs recorded from mice under isoflurane anesthesia show a relative increase in SRs in CaV1.3AG/WT and CaV1.3AG/AG mice compared to CaV1.3WT/WT. (E) Frequency tuning curves of all recorded putative SGNs with the characteristic frequency (CF)/best threshold marked by stars. (F and G) Thresholds at CF between 10 and 20 kHz (G) are comparable in CaV1.3WT/WT, CaV1.3AG/WT, and CaV1.3AG/AG mice. (H) Average peristimulus time histogram (PSTH) in response to 50-ms stimulation at the CF, 30 dB above the threshold level, and stimulation rate of 5 Hz. Shaded areas show ± SEM. (I to K) Onset firing rates (calculated from PSTH as the bin with the highest rate at the sound onset) are not changed (J), but the adapted firing rates (averaged firing rates at 35 to 40 ms after the sound onset) are decreased in SGNs of CaV1.3AG/AG mice (K). Single-unit recordings were obtained from N = 6 (CaV1.3WT/WT), 3 (CaV1.3AG/WT), and 6 (CaV1.3AG/AG) mice. Box-whisker plots with individual data points overlaid show the median, 25th, and 75th percentiles (box) and the range (whiskers). Statistical significances were determined using two-tailed Wilcoxon rank sum test for (B), two-tailed Wilcoxon rank sum test for each sound level for (C), Kruskal-Wallis test followed by Tukey-Kramer multiple comparison test for (D) and (K), and Kruskal-Wallis test for (G) and (J). Significances are reported as *P < 0.05 and **P < 0.01.
Fig. 5.
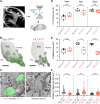
Fig. 5.. Loss of synaptic ribbons at a subset of IHC AZs in CaV1.3AG/AG mice.
(A) Schematic illustration of SBEM imaging at apical, middle, and basal segments of the mouse cochlea. (B) Three-dimensional (3D) rendering of reconstructed CaV1.3WT/WT (left) and CaV1.3AG/AG (right) IHCs contacted by SGN terminals with (green) and without (gray, “ribbonless”) associated ribbons (magenta). Scale bars, 5 μm. (C) Representative electron micrographs of ribbon-associated (green; left) and ribbonless (gray; right) SGN terminals. Scale bars, 1 μm. (D) Average numbers of SGN terminals contacting an IHC are comparable between CaV1.3AG/AG and CaV1.3WT/WT mice. (E) Average ribbon counts are significantly smaller in CaV1.3AG/AG IHCs compared to CaV1.3WT/WT at mid- and basal cochlear segments but not in the apex. (F) Mean volumes of ribbons are larger in CaV1.3AG/AG IHCs compared to CaV1.3WT/WT IHCs at mid- and basal cochlear segments, whereas apical CaV1.3AG/AG IHCs appear to have exclusively small ribbons. Each tonotopic location of each genotype represents data from N = 2 mice. Box-whisker plots with individual data points overlaid show median, 25th, and 75th percentiles (box) and the range (whiskers). Statistical significances were determined using two-tailed t test for (D) to (F). Significances are reported as **P < 0.01, ***P < 0.001, and ****P < 0.0001.
Fig. 6.
Fig. 6.. CaV1.3 gating contributes to SGN firing diversity and synaptic vulnerability.
(A) SGN spontaneous rates and thresholds vary according to the voltage dependence of presynaptic Ca2+ channel activation and glutamate release in a gene dose–dependent manner. SGN rate-level functions were modeled according to Meddis et al. (58) (see Supplementary Text, fig. S12, and table S1). Top panels summarize the path from sound to SGN code. (B) Hyperpolarized activation of CaV1.3 channels in CaV1.3AG/AG mice leads to Ca2+ influx at IHC AZs, exceeding that for both pillar and modiolar AZs in WT IHCs at physiological voltages. This results in a homeostatic reduction of Ca2+ channels and a general AZ remodeling but does not reach excitotoxic levels of Ca2+ influx and glutamate release at the ambient sound levels of the animal facility. Excitotoxic damage is likely to occur at large receptor potentials during intense sound stimulation and may preferentially affect modiolar synapses that harbor a greater Ca2+ channel complement in WT IHCs at nonphysiological stimulations, such as moderate noise exposure (shown with the dashed ellipsoid).

Similar articles

References

    1. Moser T., Karagulyan N., Neef J., Jaime Tobón L. M., Diversity matters—Extending sound intensity coding by inner hair cells via heterogeneous synapses. EMBO J. 42, e114587 (2023). - PMC - PubMed
    1. Rutherford M. A., Von Gersdorff H., Goutman J. D., Encoding sound in the cochlea: From receptor potential to afferent discharge. J. Physiol. 599, 2527–2557 (2021). - PMC - PubMed
    1. B. R. Shrestha, L. V. Goodrich, “Wiring the cochlea for sound perception” in The Oxford Handbook of the Auditory Brainstem, K. Kandler, Ed. (Oxford Univ. Press, 2019).
    1. Platzer J., Engel J., Schrott-Fischer A., Stephan K., Bova S., Chen H., Zheng H., Striessnig J., Congenital deafness and sinoatrial node dysfunction in mice lacking class D L-type Ca2+ channels. Cell 102, 89–97 (2000). - PubMed
    1. Brandt A., Striessnig J., Moser T., CaV1.3 channels are essential for development and presynaptic activity of cochlear inner hair cells. J. Neurosci. 23, 10832–10840 (2003). - PMC - PubMed

LinkOut - more resources