. 2025 Jun 20;11(25):eadv2417.
doi: 10.1126/sciadv.adv2417. Epub 2025 Jun 18.

The RNA demethylase FTO promotes glutamine metabolism in clear cell renal cell carcinoma through the regulation of SLC1A5

Affiliations

The RNA demethylase FTO promotes glutamine metabolism in clear cell renal cell carcinoma through the regulation of SLC1A5

Man Zhao et al. Sci Adv. .

Abstract

Glutamine reprogramming plays a crucial role in the growth and survival of clear cell renal cell carcinoma (ccRCC), although the mechanisms governing its regulation are still not fully understood. We demonstrate that the RNA demethylase fat mass and obesity-associated gene (FTO) drives glutamine reprogramming to support ccRCC growth and survival. Genetic and pharmacologic inhibition of FTO in ccRCC cells impaired glutamine-derived reductive carboxylation, depleted pyrimidines, and increased reactive oxygen species. This led to increased DNA damage and reduced survival, which could be rescued by pyrimidine nucleobases or the antioxidant N-acetylcysteine. Mechanistically, FTO demethylates the glutamine transporter solute carrier family 1 member 5 (SLC1A5) messenger RNA to promote its expression. Restoration of SLC1A5 expression in FTO-knockdown cells rescued metabolic and survival defects. FTO inhibition reduced ccRCC tumor xenograft and PDX growth under the renal capsule. Our findings indicate that FTO is an epitranscriptomic regulator of ccRCC glutamine reprogramming and highlight the therapeutic potential of targeting FTO for the treatment of ccRCC.


Figures

Fig. 1.
Fig. 1.. FTO inhibition reduces glutamine-derived reductive carboxylation and de novo pyrimidine synthesis in ccRCC cells.
(A) Schematic of U-13C glutamine tracing studies. Diagram of the metabolic flow of labeled carbon atoms in the TCA cycle of reductive carboxylation. Red dots denote 13C carbon atoms originating from uniformly labeled U-13C glutamine. (B and C) 786-M1A cells were pretreated with DMSO or 5 μM FB23-2 for 72 hours, then labeled with U-13C glutamine in complete medium for 10 min. Total levels of m + 5 l-glutamine and l-glutamate were measured using LC-MS and normalized to total protein levels. (D to G) 786-M1A and UMRC2 cells were labeled with U-13C glutamine for 2 hours after pretreatment with DMSO or 5 μM FB23-2 for 72 hours. (D and E) The fraction of m + 3 aspartate, malate and fumarate were analyzed using LC-MS. (F and G) The fraction of UTP and UDP was measured using LC-MS. (H) Doxycycline (Dox)–inducible shFTO knockdown was verified by Western blot analysis in 786-M1A and UMRC2 cells at 5 days post-Dox (2 μg/ml) treatment. (I and J) 786-M1A shCtrl and shFTO cells were treated with vehicle or Dox (2 μg/ml) for 5 days, then labeled with U-13C glutamine for 10 min. The metabolite enrichment of m + 5 l-glutamine and l-glutamate was measured by LC-MS. (K to N) 786-M1A and UMRC2 shCtrl and shFTO cells were pretreated with Dox (2 μg/ml) for 5 days, then labeled with U-13C glutamine for 2 hours. (K and L) The fractions of m + 3 aspartate, malate, and fumarate were analyzed using LC-MS. (M and N) The fractions of UTP and UDP were measured using LC-MS. Each column represents the mean ± SD. Biological replicates (n = 3) were analyzed in each group. Statistically significant differences are indicated: *P < 0.05; **P < 0.01; ***P < 0.001; determined by the Student’s two-tailed t test.
Fig. 2.
Fig. 2.. FTO inhibition reduces GSH biosynthesis and increases intracellular ROS levels in ccRCC cells.
(A) Total GSH levels in shCtrl and shFTO UMRC2 and 786-M1A Dox-inducible cell lines treated with Dox for 72 hours. (B) Relative GSH/GSSG ratio in UMRC2 and 786-M1A Dox-inducible shCtrl and shFTO cell lines. (C) Intracellular ROS levels were determined by carboxy-DCFDA staining in UMRC2 cells transfected with siCtrl and siFTO for 72 hours, treated with 300 μM TBHP for 1 hour, and then 10 μM DCFDA for 30 min. The DCFDA levels were normalized to corresponding unstained control. (D) Intracellular ROS levels were determined by carboxy-DCFDA staining in 786-M1A cells transfected with siCtrl and siFTO for 72 hours, treated with 200 μM TBHP for 1 hour, and then 10 μM DCFDA for 30 min. The DCFDA intensities were normalized to corresponding unstained control. Each column represents the mean ± SD. Biological replicates (n = 3) were analyzed in each group. Statistically significant differences are indicated: *P < 0.05; **P < 0.01; ***P < 0.001; determined by the Student’s two-tailed t test.
Fig. 3.
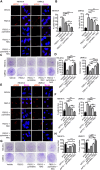
Fig. 3.. FTO inhibition increases DNA damage and impairs the growth of ccRCC cells, through decreased pyrimidine synthesis and increased ROS.
(A and B) Cells were cultured in media with vehicle or 5 μM FB23-2 and supplemented with pyrimidines (cytidine 5 μM, thymidine 5 μM, and uridine 5 μM), NAC (4 mM), or a combination of pyrimidines and NAC for 72 hours. Immunofluorescence analysis of γH2AX foci in 786-M1A cells and UMRC2 cells (A). Bar graphs show the percentage of nuclei with >50 γH2AX foci (B). At least 50 nuclei for each biological replicate were analyzed. (C and D) Colony formation assays examined the growth and survival of 786-M1A and UMRC2 cells treated with FB23-2 (5 μM), FB23-2 (5 μM) + pyrimidines (5 μM), FB23-2 (5 μM) + NAC (4 mM), and FB23-2 (5 μM) + pyrimidines (5 μM) + NAC (4 mM). (E and F) 786-M1A and UMRC2 shCtrl and shFTO cells were pretreated with Dox (2 μg/ml) for 5 days and then the cells were supplemented with pyrimidines (5 μM), NAC (4 mM), or a combination of pyrimidines and NAC for 72 hours. Immunofluorescence analysis of γH2AX foci (E). Percentage of nuclei with greater than 50 γH2AX foci (F). At least 50 nuclei for each biological replicate were analyzed. (G and H) The 786-M1A and UMRC2 shCtrl and shFTO cells were pretreated with Dox (2 μg/ml) for 5 days, then with or without supplementation with 5 μM pyrimidines, 4 mM NAC, or the combination. Cell growth and survival were determined by 2D colony formation assays. Each column represents the mean ± SD. Biological replicates (n = 3) were analyzed in each group. Statistically significant differences are indicated: *P < 0.05; **P < 0.01; ***P < 0.001; determined by the Student’s two-tailed t test.
Fig. 4.
Fig. 4.. FTO regulates SLC1A5 to promote DNA damage and tumor growth.
(A) Western blot analysis of FTO, SLC1A5, and B-actin in shCtrl, shCtrl + SLC1A5, shFTO, and shFTO + SLC1A5 786-M1A cells. 786-M1A shCtrl and shFTO cells were pretreated with Dox (2 μg/ml) for 5 days, then transfected with pcDNA-3.1 vector or pcDNA-3.1-SLC1A5 plasmid for 48 hours before extracting proteins. (B) U-13C glutamine tracing in cells. The fractions of m + 3 aspartate, malate, and fumarate were analyzed using LC-MS. (C) Relative GSH/GSSG ratio in shCtrl and shFTO 786-M1A cells pretreated with Dox (2 μg/ml) for 5 days, transfected with pcDNA-3.1 vector or pcDNA-3.1-SLC1A5 plasmid for 48 hours. (D and E) Immunofluorescence analysis of γH2AX foci of 786-M1A shCtrl and shFTO cells pretreated with Dox (2 μg/ml) for 5 days, then transfected with pcDNA-3.1 vector or pcDNA-3.1-SLC1A5 plasmid for 48 hours. Bar graphs show the percentage of nuclei with >50 γH2AX foci per nucleus. At least 50 nuclei for each biological replicate were analyzed. (F and G) Colony formation assays examined the growth and survival of shCtrl, shCtrl + SLC1A5, shFTO, and shFTO + SLC1A5 786-M1A cells. Macroscopic images of representative colonies formed in each group (F). Quantification of total colony number in each group (G). Each column represents the mean ± SD. Biological replicates (n = 3) were analyzed in each group. Statistically significant differences are indicated: *P < 0.05; **P < 0.01; ***P < 0.001; determined by the Student’s two-tailed t test.
Fig. 5.
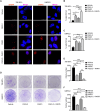
Fig. 5.. FTO inhibition enhances the efficacy of the PARP inhibitor talazoparib in ccRCC cells.
(A to C) Immunofluorescence analysis of γH2AX foci of 786-M1A and UMRC2 cells pretreated with 5 μM FB23-2 and/or 1 μM PARPi (talazoparib) for 72 hours. Bar graphs show the percentage of nuclei with >50 γH2AX foci per nucleus. At least 50 cells for each biological replicate were analyzed. (D to F) 786-M1A and UMRC2 cells were treated with vehicle or 5 μM FB23-2 in the presence or absence of 1 μM PARPi (talazoparib) in colony formation assays. Each column represents the mean ± SD. Biological replicates (n = 3) were analyzed in each group. Statistically significant differences are indicated: *P < 0.05; **P < 0.01; ***P < 0.001, ****P < 0.0001; determined by the Student’s two-tailed t test.
Fig. 6.
Fig. 6.. FTO inhibition enhances the efficacy of the PARP inhibitor talazoparib to suppress ccRCC tumor growth.
(A) Schematic of the UMRC2 in vivo therapeutic study. Cells were implanted under the renal capsule (n = 8 to 9 per group). (B) Representative MRI images of kidneys from mice treated with of FB23-2 (6 mg/kg) or PARPi (0.5 mg/kg, talazoparib) or combination (FB23-2 with PARPi). Dashed yellow line outlines the tumor area. (C) Tumor volume was monitored via MRI. (D) Weight of tumors harvested at endpoint. (E) Schematic of the RCC054 PDX in vivo therapeutic study. Tissues were implanted under the renal capsule (n = 6 to 7 per group). (F) Representative MRI images of kidneys in mice treated with FB23-2 (6 mg/kg) or PARPi (talazoparib, 0.5 mg/kg) or combination (FB23-2 with PARPi). The dashed yellow line outlines the tumor area. (G) Tumor volume was monitored via MRI. (H) Weight of tumors harvested at endpoint (n = 6 per group). Each column represents the mean ± SD. Statistically significant differences are indicated: *P < 0.05; **P < 0.01; ****P < 0.0001; determined by the student’s two-tailed t test.

Similar articles

References

    1. Bray F., Ferlay J., Soerjomataram I., Siegel R. L., Torre L. A., Jemal A., Global cancer statistics 2018: GLOBOCAN estimates of incidence and mortality worldwide for 36 cancers in 185 countries. CA Cancer J. Clin. 68, 394–424 (2018). - PubMed
    1. Jonasch E., Gao J., Rathmell W. K., Renal cell carcinoma. BMJ 349, g4797 (2014). - PMC - PubMed
    1. Hutson T. E., Thoreson G. R., Figlin R. A., Rini B. I., The evolution of systemic therapy in metastatic renal cell carcinoma. Am. Soc. Clin. Oncol. Educ. Book 35, 113–117 (2016). - PubMed
    1. Rini B. I., Campbell S. C., Escudier B., Renal cell carcinoma. Lancet 373, 1119–1132 (2009). - PubMed
    1. Siegel R. L., Miller K. D., Fuchs H. E., Jemal A., Cancer statistics, 2022. CA Cancer J. Clin. 72, 7–33 (2022). - PubMed

MeSH terms

Substances