. 2025 Jun 20;11(25):eadt9936.
doi: 10.1126/sciadv.adt9936. Epub 2025 Jun 18.

Conformational dynamics and multimodal interaction of Paxillin with the focal adhesion targeting domain

Affiliations

Conformational dynamics and multimodal interaction of Paxillin with the focal adhesion targeting domain

Supriyo Bhattacharya et al. Sci Adv. .

Abstract

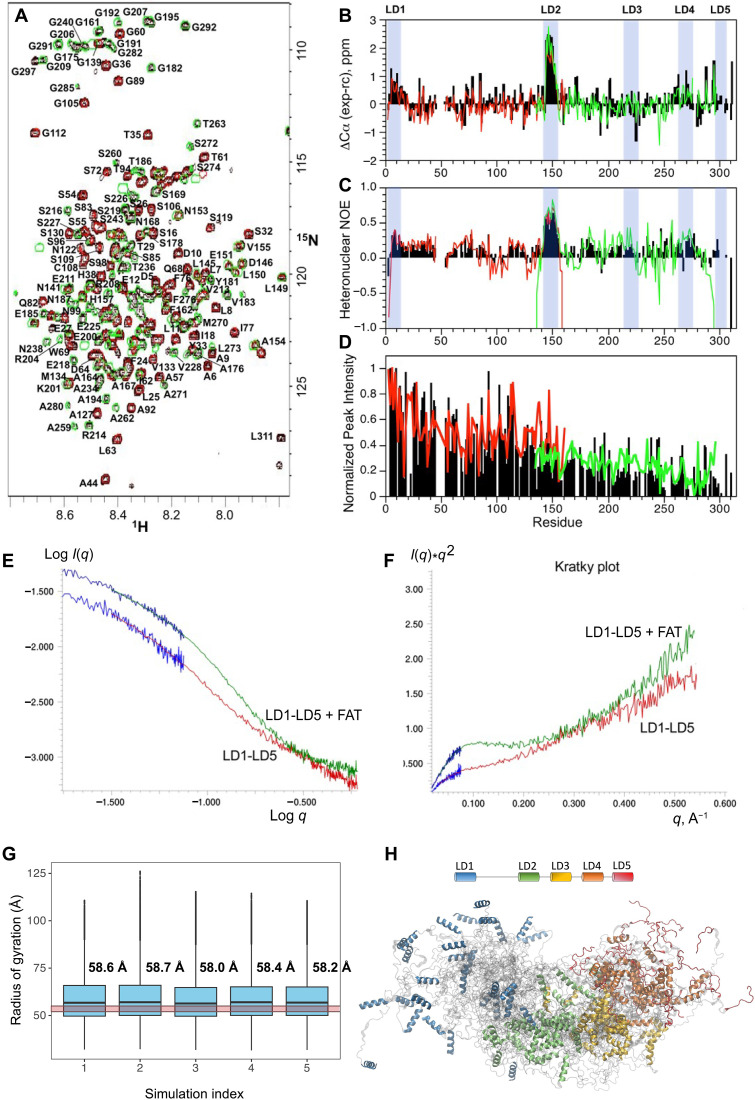
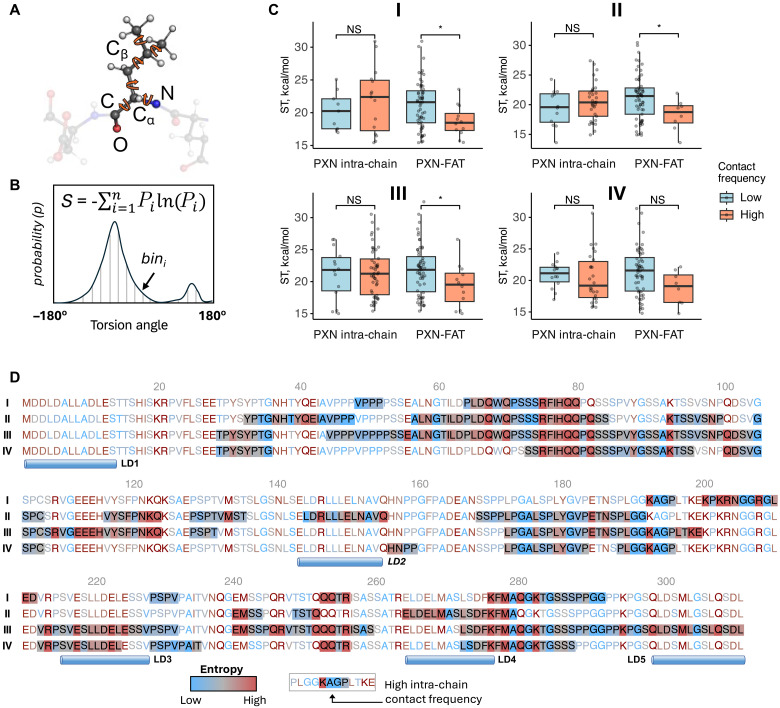
Paxillin (PXN) and focal adhesion kinase (FAK) are two major components of the focal adhesion complex, a multiprotein structure linking the intracellular cytoskeleton to the cell exterior. The interaction between the disordered amino-terminal domain of PXN and the carboxyl-terminal targeting domain of FAK (FAT) is necessary and sufficient for localizing FAK to focal adhesions. Furthermore, PXN serves as a platform for recruiting other proteins that together control the dynamic changes needed for cell migration and survival. Here, we show that the PXN N-domain undergoes significant compaction upon FAT binding, forming a 48-kilodalton multimodal complex with four major interconverting states. Although the complex is flexible, each state has unique sets of contacts involving disordered regions that are both highly represented in ensembles and conserved. PXN being a hub protein, the results provide a structural basis for understanding how shifts in the multistate equilibrium (e.g., through ligand binding and phosphorylation) may rewire cellular networks leading to phenotypic changes.


Figures

Fig. 1.
Fig. 1.. Deriving the conformational ensemble of human PXN bound to FAT.
(A) Domain organization for the α-isoform of Paxillin. Known phosphorylation (magenta asterisks) and cancer mutation (filled triangles) sites are highlighted. The amino acid sequence for the predicted intrinsically disordered 311-residue N-domain, LD1-5, is shown. (B) Schematic describing the multimodal interaction of PXN with FAT. Disordered regions in the ensemble of PXN conformations (apo and complex states) are represented by gray curves. LD motifs are depicted as cylinders and colored according to the color scheme in (A). (C) In silico pipeline for deriving multimodal PXN/FAT ensemble starting with MD simulations of the four PXN/FAT-bound states, followed by refinement using experimental PRE data.
Fig. 2.
Fig. 2.. Conformational dynamics of the human Paxillin N-domain and its compaction upon binding FAT.
(A) Two-dimensional (2D) 1H-15N HSQC spectrum of the PXN LD1-5N-domain (black) with main-chain backbone amide assignments. Overlaid spectra of the LD1-2 (red) and LD2-4 (green) fragments are also displayed. The largest differences between the shorter fragments and their corresponding regions in LD1-5 are due to end effects. (B) Secondary ΔCα shift analysis. ppm, parts per million; exp-rc, experiment - random coil. (C) Steady-state {1H}-15N heteronuclear NOE values at 600 MHz. (D) Normalized peak intensities. The color scheme for (B) to (D) is N-domain (black), LD1-2 (red), and LD2-4 (green). (E) Experimental x-ray scattering data for the PXN N-domain (red), its 1:1 complex with FAT (green), and lowest-angle scattering data acquired with the longest sample/detector distances (blue). (F) Kratky plots indicate higher degree of conformational disorder for PXN N-domain compared to its complex with FAT, as evidenced by a pronounced maximum in the complex data at q ~ 0.1 A−1, typically associated with folded protein conformations. (G) Radii of gyration observed in the AWSEM MD-derived PXN conformational ensembles from five independent simulations. Boxes represent the interquartile ranges, while the whiskers represent the two extreme quartiles. Outliers are marked by dots. The experimental radius of gyration (Rg; 52 to 55 Å) determined from SAXS is highlighted by the translucent red horizontal band. The average Rg for each simulation is given above the corresponding box. (H) PXN conformational ensemble as obtained from the MD simulations. The LD regions are colored with the color code given in the schematic at the top.
Fig. 3.
Fig. 3.. Binding of PXN N-domain to FAT.
(A) Overlaid 2D 1H-15N HSQC spectra of 100 μM 15N-labeled PXN N-domain with increasing amounts of unlabeled FAT added (black, 1:0; red, 1:0.4; green, 1:0.6; orange, 1:1). (B) Ratio of FAT-bound amide peak intensity (I) to the corresponding intensity in the unbound state (I0) versus residue for 15N-labeled PXN N-domain with 1 molar equivalent of unlabeled FAT added. (C) Plots of fraction bound versus the total FAT concentration for LD1, LD2, and LD4 regions in the PXN N-domain. Binding curves were obtained from the decay in amide peak intensities for each region as a function of FAT concentration (see Materials and Methods). (D) Overlaid 2D 1H-15N HSQC spectra of the 1:1 complex between 15N-labeled PXN LD1-2 and unlabeled FAT (black), and the same sample but with 5.45 equivalents unlabeled LD4 peptide added (red). Amide peaks due to the LD1 motif are broadened in the PXN/FAT complex but gain peak intensity (red boxes) when LD4 peptide is added, consistent with displacement of LD1 from the FAT surface. In contrast, peaks due to LD2 residues (unbound positions shown by blue circles) regain little or no peak intensity upon addition of LD4 peptide. (E) Multistate model of the interaction between the PXN N-domain and FAT under limiting FAT.
Fig. 4.
Fig. 4.. Epitope mapping on the FAT surface using intermolecular PREs indicates that LD1, LD2, and LD4 bind to the α2/α3 and α1/α4 FAT sites.
The binding mode of each LD motif to 15N-FAT was determined using the following spin-labeled PXNs: (A) PXN (LD1-2, S13C-MTSL/C108A); (B) PXN (LD2-4, S143C-MTSL); (C) PXN (LD2-4, S219C-MTSL); (D) PXN (LD2-4, S274C-MTSL); and (E) PXN (LD2-5, S302C-MTSL). For each panel, the Iox/Ired plots versus residue are shown (left). Values of Iox/Ired (≤0.5, red; between 0.5 and 0.6, orange) are mapped onto the surface of FAT showing views for both the α1/α4 and α2/α3 binding sites (right). The PXN chain (blue) is modeled from MD simulations and the attachment site of the spin label in LD1, LD2, and LD4 is indicated. Additional color-coding: green, proline; and gray, unassigned, overlapped, or exchange broadened signals for which PRE values were not obtained.
Fig. 5.
Fig. 5.. Agreement between experimental and calculated PRE intensity ratios from the MD-derived PXN-FAT ensemble.
A stable nitroxide (MTSL) spin label was placed at either (A) E984C, (D) Q1040C, (G) Q1006C, or (J) K1018C in the FAT domain (blue, circled) to probe conformational dynamics around either the α2/α3 site or the α1/α4 site of FAT. The position of the LD motif (purple), either LD1, LD2, or LD4, is indicated on the FAT structure. Experimental PREs were measured from the relative peak intensities of PXN backbone amides in the oxidized and reduced states. Reconstructed PREs were calculated from the BME-reweighted MD ensemble, combining the four states to get an ensemble average PRE value for each residue. (B, E, H, and K) Correlation between experimental and predicted PRE intensity ratios compared among the original and BME-reweighted MD ensembles. (C, F, I, and L) Experimental (yellow) and predicted (blue) PRE intensity ratios are compared along the PXN sequence. Gray bars and colored schematic below the PRE plots indicate the location of LD motifs 1 to 5. Native numbering for both PXN N-domain and FAT.
Fig. 6.
Fig. 6.. Intermolecular PRE experiments between 15N-PXN N-domain and natural abundance FAT enable analysis of the PXN conformational ensemble, including linker regions, relative to the FAT domain.
(A) Representative structures from the highest contribution cluster for each PXN/FAT state. Individual LD motifs are colored according to the schematic at the top of the panel. The FAT four-helix bundle is colored in pink. (B) Contribution of each PXN state (I to IV) to the experimental PRE intensities, obtained from the BME-reweighted MD ensemble of the PXN/FAT complex. (C) Box and whisker plot showing the Rg calculated from the BME-reweighted MD ensemble, for each of the four PXN/FAT states. Boxes represent the interquartile ranges, with the outlier MD conformations plotted along the vertical lines above and below each box. The horizontal red line is the experimental Rg (35 Å) obtained from SAXS.
Fig. 7.
Fig. 7.. Representation and clustering of PXN N-domain conformations in reduced dimension space using UMAP.
(A) Percentage contributions of all 98 clusters (arranged in decreasing order) toward the conformational ensemble of FAT-bound PXN. (B) Percentage contributions of the top clusters (with >1% contribution) from each PXN/FAT state (I to IV) showing highest contribution to experimental agreement with NMR/PRE data. (C) Positions of top PXN clusters shown in UMAP space along with the representative structure (cluster centroid using UMAP coordinates) from each cluster. Color coding of the clusters is same as in (B). LD motifs in the representative structures are colored on the basis of the color scheme given in Fig. 1A. FAT is shown as pink helices.
Fig. 8.
Fig. 8.. Intra-chain PXN contacts are highly represented and tend to be state specific.
(A) Top three most frequently observed intersegment (see figs. S9 and S11 for details) contacts among the highest populated clusters (with >1% contribution) from each MD-derived state (I to IV). Cells in the contact map are colored according to the contact frequencies of segment pairs. Short-range contacts between consecutive segments were omitted. Contacts are labeled using the first residue number belonging to each segment. For example, 77-93 indicates the contact between segments spanning residues 77 to 80 and 93 to 96. Examples of contacts that are highly represented in one of the four states and minimally detected in the other three are indicated (red dashed boxes). Contacts are arranged such that those exclusive to each state are clustered together in the heatmap. (B) Intra-chain contact frequency as function of residue number is compared among the four PXN/FAT-bound states. The top cluster-specific contacts shown in (C) are represented as open rectangles below each plot, with the termini located near the contacting residues. The height of each rectangle is according to the distance between the contacting residues along the PXN chain, while the color is according to the contact frequency. The locations of the LD helices are highlighted along the x axis. FAT-contacting LD helices are highlighted in black dashed squares. (C) Representative conformations from the four MD-derived states are displayed. For each state, the structure closest to the centroid of the highest populated cluster was chosen as the representative conformation. Helices are shown as cylinders. LD motifs are colored according to the schematic in Fig. 1A. Residue regions corresponding to the highest-frequency intra-chain contacts are highlighted as spheres (carbon, gray; oxygen, red; nitrogen, blue).
Fig. 9.
Fig. 9.. Each PXN state shows distinct FAT contacts.
(A and B) Intra-chain contact frequencies along the (A) PXN and (B) FAT sequences for the four PXN/FAT states. (C) Representative structure from each MD-derived state. PXN residue regions corresponding to the highest FAT contacts unique to each PXN/FAT state are highlighted as spheres. FAT regions corresponding to the highest-frequency PXN interactions are colored magenta. LD helices are highlighted according to the color scheme defined in Fig. 1A.
Fig. 10.
Fig. 10.. Many PXN intra-chain contacts maintain high entropy while bound to FAT.
(A) Schematic showing the backbone and side-chain torsion angles in a given amino acid residue using ball and stick representation; colors: carbon, gray; nitrogen, blue; oxygen, red; hydrogen, white. Individual torsion angles are represented as curved orange arrows. (B) Schematic representing a torsion angle probability distribution used in calculating configurational entropy. Probabilities were calculated by dividing the torsion angle range into 35 bins (i.e., bin width, 10°) and calculating the BME-reweighted frequency within each bin. The equation for Shannon entropy is given at the top of the schematic plot. (C) Box plots comparing the entropy of residues showing low (<20% of time) and high (>60% of time) intra-chain and PXN-FAT contacts in all four PXN-FAT configurations. Entropy values (S) were converted into energy units by multiplying with RT (R, universal gas constant; T, temperature of 310 K). ST, entropy x temperature. Boxes and whiskers represent the interquartile range (IQR) and 1.5 times IQR, respectively. Within each box, individual residues are shown as gray dots. Statistical significance was estimated using Wilcoxon rank sum test. P values for significance levels were defined as follows: *, 0.01 to 0.05; not significant (NS), >0.05. (D) PXN sequence colored by residue-wise entropy for all four configurations. Regions showing high (>60% of time) intra-chain contact frequency are highlighted with colored backgrounds. Blue cylinders representing the locations of individual LD motifs are shown below.

Update of

Similar articles

Cited by

References

    1. Chen C. S., Alonso J. L., Ostuni E., Whitesides G. M., Ingber D. E., Cell shape provides global control of focal adhesion assembly. Biochem. Biophys. Res. Commun. 307, 355–361 (2003). - PubMed
    1. Bertolucci C. M., Guibao C. D., Zheng J., Structural features of the focal adhesion kinase-paxillin complex give insight into the dynamics of focal adhesion assembly. Protein Sci. 14, 644–652 (2005). - PMC - PubMed
    1. Parsons J. T., Martin K. H., Slack J. K., Taylor J. M., Weed S. A., Focal adhesion kinase: A regulator of focal adhesion dynamics and cell movement. Oncogene 19, 5606–5613 (2000). - PubMed
    1. Burridge K., Focal adhesions: A personal perspective on a half century of progress. FEBS J. 284, 3355–3361 (2017). - PMC - PubMed
    1. Legerstee K., Geverts B., Slotman J. A., Houtsmuller A. B., Dynamics and distribution of paxillin, vinculin, zyxin and VASP depend on focal adhesion location and orientation. Sci. Rep. 9, 10460 (2019). - PMC - PubMed

Substances

LinkOut - more resources