. 2025 Jul;603(14):3987-4004.
doi: 10.1113/JP287508. Epub 2025 Jun 18.

The stretch-shortening cycle effect is not associated with cortical or spinal excitability modulations

Affiliations

The stretch-shortening cycle effect is not associated with cortical or spinal excitability modulations

Lea-Fedia Rissmann et al. J Physiol. 2025 Jul.

Abstract

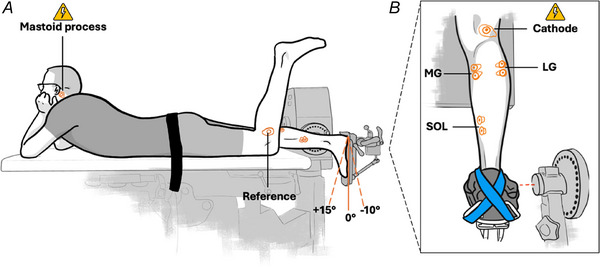
It is unclear whether cortical and spinal excitability modulations contribute to enhanced stretch-shortening cycle (SSC) performance. Therefore, this study investigated cortical and spinal excitability modulations during and following shortening of SSC contractions compared with pure shortening (SHO) contractions. Participants (n = 18) performed submaximal voluntary plantar flexion contractions while prone on the dynamometer bench. The right foot was strapped onto the dynamometer's footplate attachment, and the resultant ankle joint torque and crank arm angle were recorded. Cortical and spinal excitability modulations of the soleus muscle were analysed by eliciting compound muscle actional potentials via electrical nerve stimulation, cervicomedullary motor-evoked potentials (CMEPs) via electrical stimulation of the spinal cord, and motor-evoked potentials (MEPs) via magnetic stimulation of the motor cortex. Mean torque following stretch was significantly increased by 7 ± 3% (P = 0.029) compared with the fixed-end reference (REF) contraction, and mean torque during shortening of SSC compared with SHO was significantly increased by 12 ± 24% (P = 0.046). Mean steady-state torque was significantly lower by 13 ± 3% (P = 0.006) and 9 ± 12% (P = 0.011) following SSC compared with REF and SHO, respectively. Mean steady-state torque was not significantly different following SHO compared with REF (7 ± 8%, P = 0.456). CMEPs and MEPs were also not significantly different during shortening of SSC compared with SHO (P ≥ 0.885) or during the steady state of SSC, SHO and REF (P ≥ 0.727). Therefore, our results indicate that SSC performance was not associated with cortical or spinal excitability modulations during or after shortening, but rather driven by mechanical mechanisms triggered during active stretch. KEY POINTS: A stretch-shortening cycle (SSC) effect of 12% was observed during EMG-matched submaximal voluntary contractions of the human plantar flexors. The SSC effect was neither associated with cortical or spinal excitability modulations nor with stretch-reflex activity. The SSC effect was likely driven by mechanical mechanisms related to active muscle stretch, which have long-lasting effects during shortening. Residual force depression following SSC was not attenuated by the long-lasting mechanical mechanisms triggered during active muscle stretch. Steady-state torques were lower following shortening of SSCs versus pure shortening and fixed-end contractions at the same final ankle joint angle, but the torque differences were not correlated with cortical or spinal excitability modulations.

Keywords: force depression; force enhancement; performance enhancement; stretch reflex; triceps surae.


Conflict of interest statement

The authors declare they have no competing interests.

Figures

Figure 1
Figure 1. Participant set‐up on the dynamometer and electrode placement on the right triceps surae
Participant laid prone on the bench of a dynamometer with the right foot strapped onto a footplate attachment. The participants’ waist was fixed with a belt. Neutral position (i.e. foot plate perpendicular to the shank) was defined as 0°. The range of motion was set from −10° plantarflexed (PF) position to +15° dorsiflexed (DF) position. Knee and hips were fully extended. Participants had to keep their head up and supported in their hands during all contractions. The reference electrode for recording muscle activity and responses to stimulations was placed on the left fibular head. A, electrodes for spinal cord stimulation (voltage symbol) at the cervicomedullary junction were placed over the grooves behind the mastoid processes, with the cathode on the left side of the head. B, electrode placement for the recording of muscle activity and responses to stimulations of SOL, MG and LG. Electrode placement is also shown for the cathode for electric nerve stimulation (voltage symbol) within the popliteal fossa. The lateral malleolus was aligned with the axis of the dynamometer. A strap was used to firmly fix the foot to the footplate attachment. [Colour figure can be viewed at wileyonlinelibrary.com]
Figure 2
Figure 2. Exemplary Mmax, CMEP and MEP voltage–time responses
Individual raw EMG amplitude–time traces following stimulation from one representative participant in mV (individual muscle gains were accounted for). Mmax (green), CMEP (orange) and MEP (purple). The instant of stimulation is indicated by ‘Stim’. The size of the responses was calculated as the peak‐to‐peak amplitude. [Colour figure can be viewed at wileyonlinelibrary.com]
Figure 3
Figure 3. Mean crank arm angle–time (A and B), resultant torque–time (C and D) and root mean squared (200 ms) soleus muscle activity (EMGSOL) averaged from all participants during reference in plantarflexed position (REFPF), pure shortening (SHO) and stretch–shortening (SSC) (n = 15) (A, C and E) and reference in dorsal flexed position (REFDF) and pure stretch (STR) (n = 12) (B, D and F)
A, the instant of stimulation during the shortening phase in SHO (green) and SSC (dark blue) is labelled Stim 1. The instant of stimulation during the steady state of REFPF (violet), SHO and SSC and is labelled Stim 2. B, no stimulation was applied during REFDF (orange) and STR (blue). C and D, the dark grey bars indicate the time period over which torque was averaged during shortening and during the steady state for each contraction condition. E and F, the light grey bars indicate the period over which EMGSOL was averaged during shortening and during the steady state for each contraction condition and each muscle. [Colour figure can be viewed at wileyonlinelibrary.com]
Figure 4
Figure 4. Recorded plantar flexion torques among the contraction conditions
Student's paired t test was used to assess mean differences in averaged torque between SHO and SSC during shortening (A), a one‐way repeated‐measures ANOVA to assess mean differences in averaged torque between REFPF, SHO and SSC following shortening (B) and a Wilcoxon test to assess mean differences in torque between REFDF and STR (C). Torque during the shortening phase was significantly enhanced during SSC compared with SHO (A), significantly lower following SSC compared with REFPF (B) and compared with SHO (C) and significantly enhanced following STR compared with REFDF. Individual data points are presented as filled circles, mean data points as black horizontal lines connected by broken lines, and significant differences between conditions (P ≤ 0.05) are indicated by an asterisk. Paired values are indicated by connecting lines and identical symbol colours. During shortening, n = 12 (A). During the steady state, n = 15 for REFPF, SHO and SSC (B), and n = 11 for REFDF and STR (C). [Colour figure can be viewed at wileyonlinelibrary.com]
Figure 5
Figure 5. Recorded responses obtained from soleus muscle during the contraction conditions including a stimulation
Neither a paired t test (during shortening: SHO vs. SSC) nor a one‐way repeated‐measures ANOVA (during steady state: REFPF vs. SHO vs. SSC) indicated significant differences in mean Mmax among contraction conditions (A and B). Further, a two‐way repeated‐measures restricted maximum likelihood mixed‐effects model did not indicate mean differences in normalized MEP (C and D) or CMEP responses (E and F). Individual data points are presented as filled circles and mean data points as black horizontal lines connected by broken lines. Paired values are indicated by connecting lines and identical symbol colours. Mmax sizes are presented in mV as individual data points (n = 15) during shortening (A) and (n = 15) during the steady state (B). MEP and CMEP sizes were normalized to the Mmax size from the corresponding contraction condition. MEP/Mmax sizes are presented as a percetage as individual data points (n = 14) during shortening (C) and (n = 13) during the steady state (D). Similarly, CMEP/Mmax sizes are presented as a percetage as individual data points (n = 13) during shortening (E) and (n = 12) during the steady state (F). [Colour figure can be viewed at wileyonlinelibrary.com]
Figure 6
Figure 6. Scatter plots of delta (∆) in cortical excitability (A and C) and ∆ in spinal excitability (B and D) of the soleus muscle in relation to the SSC effect % (A and B) and in relation to rFD % (C and D) and the SSC effect % relative to rFE % (E) and rFD % (F)
Pearson's correlation coefficient was calculated to assess the strength of the relations between (1) the SSC effect% or (2) between rFD% (REFPF vs. SHO, REFPF vs. SSC) and the delta cortical excitability or the delta spinal excitability. Pearson's correlation coefficient was calculated to assess the strength of the relations between the SSC effect% and (3) rFE% (REFDF vs. STR) or (4) rFD% (SHO vs. SSC). No significant correlations were found (P > 0.005). Individual data points are indicated by assigned different colours. Delta cortical excitability was calculated from the difference between normalized MEP and normalized CMEP sizes during the shortening phase (A) and during the steady state (C). Delta spinal excitability was calculated from the difference between the normalized CMEP sizes during the shortening phase (B) and during the steady state (D). Coloured circles indicate the correlation between the delta excitability and SSC effect% (SSC vs. SHO) (A and B) or between rFD% (REFPF vs. SSC) (C and D) and coloured triangles indicate the correlation between the delta excitability and rFD% (REFPF vs. SHO) (C and D). Coloured diamonds indicate the correlation between the SSC effect% and rFE% (E) and coloured squares indicate the correlation between the SSC effect% and rFD% (SHO vs. SSC) (F). [Colour figure can be viewed at wileyonlinelibrary.com]

Similar articles

References

    1. Abbott, B. C. , & Aubert, X. M. (1952). The force exerted by active striated muscle during and after change of length. The Journal of Physiology, 117(1), 77–86. - PMC - PubMed
    1. Bakenecker, P. , Raiteri, B. J. , & Hahn, D. (2020). Force enhancement in the human vastus lateralis is muscle‐length‐dependent following stretch but not during stretch. European Journal of Applied Physiology, 120(12), 2597–2610. - PMC - PubMed
    1. Bakenecker, P. , Weingarten, T. , Hahn, D. , & Raiteri, B. (2022). Residual force enhancement is affected more by quadriceps muscle length than stretch amplitude. eLife, 11, e77553. - PMC - PubMed
    1. Brownstein, C. G. , Ansdell, P. , Škarabot, J. , Howatson, G. , Goodall, S. , & Thomas, K. (2018). An optimal protocol for measurement of corticospinal excitability, short intracortical inhibition and intracortical facilitation in the rectus femoris. Journal of the Neurological Sciences, 394, 45–56. - PubMed
    1. Cavagna, G. A. , Dusman, B. , & Margaria, R. (1968). Positive work done by a previously stretched muscle. Journal of Applied Physiology, 24(1), 21–32. - PubMed

LinkOut - more resources