. 2025 Jun 18;21(6):e1012839.
doi: 10.1371/journal.ppat.1012839. eCollection 2025 Jun.

Experimental evolution of a pathogen confronted with innate immune memory increases variation in virulence

Affiliations

Experimental evolution of a pathogen confronted with innate immune memory increases variation in virulence

Ana Korša et al. PLoS Pathog. .

Abstract

Understanding the drivers and mechanisms of virulence evolution is still a major goal of evolutionary biologists and epidemiologists. Theory predicts that the way virulence evolves depends on the balance between the benefits and costs it provides to pathogen fitness. Additionally, host responses to infections, such as resistance or tolerance, play a critical role in shaping virulence evolution. But, while the evolution of pathogens has been traditionally studied under the selection pressure of host adaptive immunity, less is known about their evolution when confronted to simpler and less effective forms of immunity such as immune priming. In this study, we used a well-established insect model for immune priming - red flour beetles and their bacterial pathogen Bacillus thuringiensis tenebrionis - to test how this form of innate immune memory drives the pathogen evolution. Through controlled experimental evolution of the pathogen in primed versus non-primed hosts, we found no change in average virulence after eight selection cycles in primed host. Nonetheless, we observed a notable rise in the variability of virulence, defined as the ability to kill hosts, among independent pathogen lines that evolved in primed hosts, and the bacteria were unable to develop resistance to host priming. Whole genome sequencing revealed increased activity in the bacterial mobilome (prophages and plasmids). Expression of the Cry toxin - a well-known virulence factor - was linked to evolved differences in copy number variation of the cry-carrying plasmid, though this did not correlate directly with virulence. These findings highlight that innate immune memory can drive variability in pathogen traits, which may favor adaptation to variable environments. This underscores the need to consider pathogen evolution in response to innate immune memory when applying these mechanisms in medicine, aquaculture, pest control, and insect mass production.


Conflict of interest statement

The authors have declared that no competing interests exist.

Figures

Fig 1
Fig 1. Experimental design.
We inoculated one colony of the pathogen Bacillus thuringiensis tenebrionis (Btt) into 100 mL of Btt medium. After 7 days of sporulation, we harvested the spores, adjusted the concentration to 5x10^9, and produced an infection diet that was offered to individual primed and control 15 days old beetle larvae (n = 192 per replicate line and cycle). For each selection cycle, we used Btt spores from cadavers of T. castaneum larvae killed by the infection in the previous cycle and produced eight bacterial lines per selection treatment. For each bacterial line, we isolated spores from five cadavers, which were subsequently grown independently in a sporulation medium to achieve high spore numbers for the infection of a sufficient number of beetle larvae for the next infection cycle. In each selection cycle, bacteria reproduced and sporulated within their host followed by amplification in culture medium. We had eight independently evolving pathogen replicate lines each for evolution in control and primed hosts. After eight selection cycles, we phenotyped and genotyped all evolved pathogen lines (P1-8, C1-8) and the ancestral pathogen. For the ancestral pathogen, we produced pseudo-replicates (A1-8), i.e., lines that had not undergone any selection process, but had grown in separate flasks to control for possible variations from growth in the medium. For phenotyping, we quantified virulence (proportion of host mortality) and transmission (spore growth in cadavers) in two different host environments (primed and control). We also measured spore growth in a liquid medium. For genotyping, we sequenced the whole genomes of the 24 lines and quantified phage and plasmid coverage. We also measured the expression of a key virulence factor, the Cry-encoding gene, with RT-qPCR. Insect drawings by Helle Jensen.
Fig 2
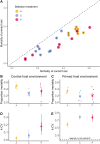
Fig 2. Virulence (proportion of host mortality) of pathogen lines
A. Correlation between the virulence in primed and control hosts, showing raw data of each independent replicate in primed and control host environment larvae. The dotted line shows where the mortality rates of control and primed hosts would be equal. All pathogen lines are below this line, indicating lower pathogen virulence in primed compared to control hosts (i.e., a ‘priming effect’). In panels B to E, large solid circles represent the posterior mean of the Bayesian model, and the smaller circles the raw data corresponding to the independent pathogen replicate line. Additionally, the thick and thin bars represent the 68% and 95% HDI, equivalent to a normal distribution’s 1 and 2 standard deviations. Panels B and C show the virulence in control and primed host environments. Panels D and E show posterior estimates of k-CV, which is a measure of dispersion, calculated from the coefficient of variation. Points show the median estimates, and error bars represent the credible intervals (HDCI), indicating uncertainty.
Fig 3
Fig 3. Spore growth in A) primed and B) control hosts. The dots correspond to the mean of ten measurements for each independent pathogen line.
The plot shows the mean and the confidence intervals. Ancestral Btt produced more spores than both evolved lines, but only in the primed host environment (lmer: X 2 = 8.808, Df = 2, p = 0.012, and there seemed to be a weak difference in pathogen load between the evolved lines (p = 0.973). Letters denote significant differences between the selection treatments. C. Correlation between the spore load in primed and control hosts, showing the number of spores each independent replicate produces in primed and control beetle cadaver. The dotted line shows where the spore load in control hosts and primed hosts would be equal. D Spore growth in the medium. Each dot represents the mean of three independent measures of one pathogen line. The graph shows the mean and confidence intervals. Primed- and control-evolved lines produced fewer spores than the ancestral strain (p < 0.001).
Fig 4
Fig 4. Priming sensitivity and fitness in the host.
Each dot corresponds to bacterial replicate line and the box shows mean and confidence intervals. A Priming sensitivity of bacterial replicates was calculated by dividing the proportion of mortality in control/the proportion of mortality in primed hosts. The higher the value, the more sensitive the pathogen is towards host priming. Selection treatment affected the priming sensitivity (X2 = 5.985, Df = 2, p = 0.050), with the primed-evolved pathogen exhibiting the highest priming sensitivity compared to the ancestral pathogen (p = 0.058). B Fitness in the host of each bacterial line was calculated as mortality proportion X spore load. Selection treatment and host environment significantly influenced host fitness (X 2 = 40.385, df = 5, p < 0.001). Pairwise comparisons confirmed that all the selection treatment levels have lower fitness in the priming host environment. C Pearson’s correlation between priming sensitivity and average fitness in the host (mean of fitness in primed and control host environment). A, C, and P stand for evolution treatment levels: Ancestral, Control, and Primed evolved pathogen, respectively.
Fig 5
Fig 5. Heatmap displaying the identified single nucleotide variants (SNVs) and structural variants (SVs) at the respective genomic positions.
Variants in any line with an alternative allele fraction of >=10% of total read coverage are displayed. Alternative allele fraction of each variant for all remaining lines was calculated by dividing alternative allele coverage by total read coverage at that position (red = 100% alternative allele or fraction 1, yellow = 0% alternative allele or fraction 0). Individual lines are ordered within the respective evolution treatment by virulence (cf. Fig 2), from low to high (arrows).
Fig 6
Fig 6. A Log2 transformed plasmid coverage divided by chromosome coverage (relative plasmid coverage).
Shown are the respective mean values and their standard error. * adjusted p < 0.05 B Correlation of the Log2 transformed cry3Aa gene coverage divided by chromosome coverage (relative cry3Aa gene coverage) and delta CT of housekeeping gene expression subtracted by cry3Aa gene expression (relative cry3Aa gene expression). The p-value from the linear regression analysis (lm(Cry_expr ~ Cry_cov)) indicates a significant effect of cry3Aa gene coverage on cry3Aa gene expression.
Fig 7
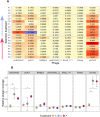
Fig 7. Analysis of log2 transformed values of phage coverage divided by chromosome coverage (relative phage coverage).
A = Heatmap for each replicate line. A = ancestral, C = control evolved, P = primed evolved. The lines are ordered by evolution treatment and by virulence where the arrow indicates the increase of virulence. Colour gradient indicates high to middle to low relative phage coverage (red to yellow to blue). B Mean values of relative phage coverage for selection treatment and their standard error. * adjusted p < 0.05.

Similar articles

References

    1. Casadevall A, Pirofski LA. Host-pathogen interactions: redefining the basic concepts of virulence and pathogenicity. Infect Immun. 1999;67(8):3703–13. doi: 10.1128/IAI.67.8.3703-3713.1999 - DOI - PMC - PubMed
    1. Read AF. The evolution of virulence. Trends Microbiol. 1994;2(3):73–6. doi: 10.1016/0966-842x(94)90537-1 - DOI - PubMed
    1. Mackinnon MJ, Gandon S, Read AF. Virulence evolution in response to vaccination: The case of malaria. Vaccine. 2008;26(Suppl 3(48-5)): C42–C52. doi: . doi:10.1016/j.vaccine.2008.04.012. - DOI - PMC - PubMed
    1. Schmid-Hempel P. Evolutionary Parasitology: The Integrated Study of Infections, Immunology, Ecology, and Genetics [Internet]. Oxford University Press; 2013. [cited 2023 Jul 18]. Available from: doi: 10.1093/acprof:oso/9780199229482.001.0001 - DOI
    1. Fenner F, Marshall ID. A comparison of the virulence for European rabbits (Oryctolagus cuniculus) of strains of myxoma virus recovered in the field in Australia, Europe and America. J Hyg (Lond). 1957;55(2):149–91. doi: 10.1017/s0022172400037098 - DOI - PMC - PubMed

MeSH terms

LinkOut - more resources