. 2025 Sep 4;188(18):5100-5117.e26.
doi: 10.1016/j.cell.2025.05.027. Epub 2025 Jun 17.

STAMP: Single-cell transcriptomics analysis and multimodal profiling through imaging

Affiliations

STAMP: Single-cell transcriptomics analysis and multimodal profiling through imaging

Emanuele Pitino et al. Cell. .

Abstract

Single-cell RNA sequencing has revolutionized our understanding of cellular diversity but remains constrained by scalability, high costs, and the destruction of cells during analysis. To overcome these challenges, we developed STAMP (single-cell transcriptomics analysis and multimodal profiling), a highly scalable approach for the profiling of single cells. By leveraging transcriptomics and proteomics imaging platforms, STAMP eliminates sequencing costs, enabling cost-efficient single-cell genomics of millions of cells. Immobilizing (stamping) cells in suspension onto imaging slides, STAMP supports multimodal (RNA, protein, and H&E) profiling, while retaining cellular structure and morphology. We demonstrate STAMP's versatility by profiling peripheral blood mononuclear cells, cell lines, and stem cells. We highlight the capability of STAMP to identify ultra-rare cell populations, simulate clinical applications, and show its utility for large-scale perturbation studies. In total, we present data for 10,962,092 high-quality cells/nuclei and 6,030,429,954 transcripts. STAMP makes high-resolution cellular profiling more accessible, scalable, and affordable.

Keywords: cell atlas; circulating tumor cells; genomics; imaging; multimodal; phenotyping; proteomics; single cell; stem cells; transcriptomics.


Conflict of interest statement

Declaration of interests H.H. is co-founder and chief scientific officer of Omniscope, a scientific advisory board member at Nanostring/Bruker and Mirxes, a consultant for Moderna and Singularity, and has received honoraria from Genentech. L.G.M. is scientific advisor of ArgenTag. L.G.M. and J.T.P. have filed a patent application based on this work (US Provisional Patent Application no. 63/723,044;63/737,985).

Figures

Figure 1.
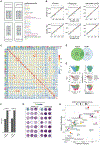
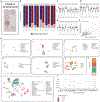
Figure 1.. Sequencing-free single-cell genomics through imaging
(A) Immunofluorescence (IF) image of STAMP-C highlighting DAPI staining (blue), CD298/B2M (red), and pan-cytokeratin (PanCK, green) across the four sub-STAMPs. Marker genes specific to cell lines are highlighted: KLK3 for LNCaP (yellow), GATA3 for MCF-7 (magenta), and KRT7 for SK-BR-3 (cyan). Enlarged region of interest (ROI1) with post-STAMP hematoxylin and eosin staining. In ROI2, each dot represents a transcript and white lines indicate segmented cell borders (scale bar, 750 μm unless otherwise noted). (B) Quality metrics for the mixed sub-STAMP containing equal proportions of MCF-7, LNCaP, and SK-BR-3 cell lines (median values of transcript counts, features, and cell areas prior to filtering). (C) UMAP of the mixed sub-STAMP, colored by InSituType unsupervised clustering. (D) Composition of the 99 fields of view (FOVs) in the mixed sub-STAMP (as in C). (E) Heatmap displaying the top 10 marker genes for each cluster identified in (C) normalized by feature. Related to Figure S1.
Figure 2.
Figure 2.. Sensitive capture of low-input cell numbers
(A) STAMP-C with 6 sub-STAMPs with low cell seeding (sub-STAMPs: 100, 250, 500, 1,000, and 20,000 cells and 20,000 nuclei; C: cells, N: nuclei). Each dot is a cell detected by imaging (px: pixels). (B) Percentage of cells retrieved from input across sub-STAMPS. Labels indicate absolute cell counts. (C) Proportions of tumor cell lines across sub-STAMPs. (D–F) Boxplot displaying the number of counts (D), features (E), and cell area (F) for each sub-STAMP. (G) Pearson correlation of raw counts averaged by cell number between cells and nuclei. Each dot is a gene (red line shows the fitted linear regression). p < 0.05. (H) Number of detected cells, transcripts, genes, and cell area for each cell line in each STAMP-X (replicate 1 and 2). (I) Pearson correlation of raw counts averaged by cell number between MCF-7 and SK-BR-3 replicates. p < 0.05.
Figure 3.
Figure 3.. Sample multiplexing across platforms
(A) Layout of multiplexed conditions profiled with the STAMP-C (top) and STAMP-X (bottom), each with replicates. (B) Pearson correlations comparing the number of counts, features, and cell area across replicates for STAMP-C (top) and STAMP-X (bottom). p < 0.05. (C) Gene-wise aggregated counts showing high Pearson correlations across samples and replicates. (D) Overlap of genes between the Xenium Prime 5K Human Pan Tissue & Pathways Panel and the CosMx Human 6K Discovery Panel, demonstrating complementary profiling capabilities. (E) Principal-component analysis (PCA) plots of unintegrated data (left) and integrated data (right), colored by technology (top), replicate uniqueness (middle), and sample identity (bottom). (F) Local inverse Simpson’s index (LISI) scores calculated by technology (left) and replicate (right), illustrating improved data integration performance. (G) AUCell scores for the Biocarta lymphocyte pathway across Xenium replicates. (H) Scatterplot of AUCell scores for Hallmark Hypoxia (x axis) and Hallmark Glycolysis (y axis). Each point represents a sample (point size: AUCell GOBP lactate metabolic process).
Figure 4.
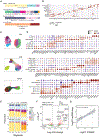
Figure 4.. Immuno-phenotyping of millions of circulating blood cells
(A) Cell numbers and proportions for the full PBMC dataset by immune lineage. (B) Dot plot displaying cell-type-defining marker genes normalized by feature. (C) UMAP visualizations of T cell and myeloid compartments (cells colored by cluster). (D) Dot plot showing normalized expression of cell-type-specific marker genes for clusters identified in (C). (DC, dendritic cells; pDC, plasmacytoid dendritic cells; non-class. Mono, non-classical monocytes; int. Mono, intermediate monocytes; infl. mono, inflammatory monocytes; class. Mono, classical monocytes; TN, naive T cells; TCM, central memory T cells; TEM, effector memory T cells; TPM, peripheral memory T cells; T eff, effector T cells; T act, activated T cells; T cyto, cytotoxic T cells; T inf. resp, interferon responder T cells. (E) Cell type proportions of PBMCs cultured under control conditions (left), LPS stimulation (middle), or anti-CD3/CD28 stimulation (right) at 4 h (top) and 24 h (bottom). (F) Volcano plot of differentially expressed genes in activated monocytes, comparing LPS versus control (4 h). (G) Pearson correlation on LogFC of genes differentially expressed in both STAMP (x axis) and Flex scRNA-seq (y axis). Related to Figures S3 and S4. p < 0.05.
Figure 5.
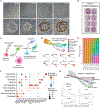
Figure 5.. Profiling cell state dynamics during stem cell differentiation
(A) Representative images of H1 (WA01) hESCs treated with BMP4 (50 ng/mL) for 0, 6, 12, 24, 48, 72, 96, and 120 h (scale bars: 200 μm). (B) STAMP slide layout of the eight BMP4-treatment time points after H&E-stained post-STAMP-C. (C) Schematic illustrating the expected differentiation trajectories of hESCs following BMP4 induction. (D) A force-directed layout of cells from all time points based on diffusion maps (Palantir). Cells are colored by annotated cell states (top) and displayed separately for each time point (bottom). (E) The proportions of annotated cell states at each time point (as in D). (F) Dot plot highlighting the main marker genes used for cell state annotation. (G) Differentiation trajectories for the amnion, endoderm, and mesoderm branches (Palantir), with expression trends of selected marker genes along the pseudotime trajectories. Related to Figure S5.
Figure 6.
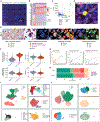
Figure 6.. Circulating tumor cells mimics and multimodal analysis
(A) Immunofluorescence image of a FOV with three CTCs (staining DAPI, PanCK, CD298/B2M, and CD45). (B) Heatmap of MCF-7 and PBMC gene signatures derived from differential expression analysis of the scRNA-seq dataset (subsetted to CosMx 1K panel). (C) Scatterplot of the MCF-7 signature score (as in B) and PanCK mean fluorescence intensity (MFI) of the 10 CTC-mimic. Each dot represents a cell (size proportional to cell area and color coded by the number of counts). (D) Immunofluorescence image highlighting a DAPI+ PanCK+ CD45− CTC-mimic (as in C; #1.2). (E) Multimodal visualization of a CTC-mimic identified in STAMP-X, including cell type markers and images of (i) H&E at low and (ii) high magnification, (iii) DAPI, (iv) Xenium cell segmentation, (v) segmented cells colored by cluster ID (Xenium Explorer), (vi) cell boundaries colored by cluster ID with PanCK staining, (vii) cell boundaries colored by cluster ID with immune cell marker staining. (F) Protein counts of PBMCs from CosMX and Phenocycler Fusion. Aggregated fluorescence per cell (left) and cell area (μm2, right). (G) Average expression of protein panels showing high correlation within and across platforms (MFI, mean fluorescence intensity; R and p value statistics from Pearson correlation). (H) Cell proportions detected by multimodal profiling of RNA and protein (STAMP-X/X-CP/CP and STAMP-X/X-PCF/PCF). (I) UMAP visualization of RNA STAMP-X-CP with unsupervised clustering and cell type annotations. (J) UMAP visualization of protein STAMP-X-CP with unsupervised clustering and cell type annotations. Related to Figure S6.
Figure 7.
Figure 7.. Profiling dissociated tissues with STAMP
(A) Diagram of tissue STAMP design performed on cells dissociated from mouse tissues: brain, heart, kidney, liver, and lung—as well as a 1:1:1:1:1 mixture of cells from these organs. (B) Bar plot showing the proportion of high- and low-quality cells and nuclei for each mouse organ. (C) Boxplot showing the number (in natural log) of transcripts captured by tissue STAMP and cell isolation. (D) Boxplot of number of genes (in natural log) detected in cells from tissue STAMP across different organs. (E) Boxplot of the distribution of cell areas captured in tissue STAMP. (F) Scatterplot of average gene expression comparison between cells and nuclei across all tissue STAMP datasets. p < 0.05. (G) UMAP visualizations of cell clusters from individual mouse tissues: (i) brain, (ii) heart, (iii) lung, (iv) liver, (v) kidney, and (vi) a mixed cell population from all five organs. (H) Proportion of cells detected across organ types in the cell mixture. (I) UMAP visualization of all cell types identified in the mixed population from the five organs. (J) Dot plot highlighting the most highly expressed marker genes for each organ type. See also Figures S7E-S7H.

References

    1. Wen L, Li G, Huang T, Geng W, Pei H, Yang J, Zhu M, Zhang P, Hou R, Tian G, et al. (2022). Single-cell technologies: From research to application. Innovation (Camb) 3, 100342. 10.1016/j.xinn.2022.100342. - DOI - PMC - PubMed
    1. Regev A, Teichmann SA, Lander ES, Amit I, Benoist C, Birney E, Bodenmiller B, Campbell P, Carninci P, Clatworthy M, et al. (2017). The Human Cell Atlas. eLife 6, e27041. 10.7554/eLife.27041. - DOI - PMC - PubMed
    1. Li H, Janssens J, De Waegeneer M, Kolluru SS, Davie K, Gardeux V, Saelens W, David FPA, Brbić M, Spanier K, et al. (2022). Fly Cell Atlas: A single-nucleus transcriptomic atlas of the adult fruit fly. Science 375, eabk2432. 10.1126/science.abk2432. - DOI - PMC - PubMed
    1. Wang R, Zhang P, Wang J, Ma L, E W, Suo S, Jiang M, Li J, Chen H, Sun H, et al. (2023). Construction of a cross-species cell landscape at single-cell level. Nucleic Acids Res. 51, 501–516. 10.1093/nar/gkac633. - DOI - PMC - PubMed
    1. Yamawaki TM, Lu DR, Ellwanger DC, Bhatt D, Manzanillo P, Arias V, Zhou H, Yoon OK, Homann O, Wang S, et al. (2021). Systematic comparison of high-throughput single-cell RNA-seq methods for immune cell profiling. BMC Genomics 22, 66. 10.1186/s12864-020-07358-4. - DOI - PMC - PubMed

MeSH terms

LinkOut - more resources