. 2025 Jun 18;16(1):458.
doi: 10.1038/s41419-025-07764-0.

N6-methyladenosine-modified GPX2 impacts cancer cell stemness and TKI resistance through regulating of redox metabolism

Affiliations

N6-methyladenosine-modified GPX2 impacts cancer cell stemness and TKI resistance through regulating of redox metabolism

Xu Yang et al. Cell Death Dis. .

Abstract

As a predominant oncogenic driver in non-small cell lung cancer (NSCLC), EGFR frequently undergoes amplification or mutation, with EGFR-tyrosine kinase inhibitors (EGFR-TKIs) like gefitinib and erlotinib constituting frontline therapy for advanced EGFR-mutant cases. However, both primary and acquired resistance significantly limit clinical efficacy. Here, we revealed that glutathione metabolic pathway controlled by glutathione peroxidase GPX2 was abnormally activated in gefitinib-resistant A549 and HCC827-GR cell lines. Mechanistically, GPX2 triggers Hedgehog signaling activation through releasing GLI transcriptional regulator, promoting cancer stem cell (CSC) characteristics and TKI resistance. Notably, N6-methyladenosine (m6A) modification on GPX2 mRNA mediated by METTL14 diminished its stability. In vivo, GPX2 deletion constrained glutathione metabolism and boosted the effectiveness of TKI in cell line-derived xenograft models. Collectively, these findings demonstrate that GPX2 serves as a positive regulator of both primary and acquired EGFR-TKI resistance and could be a promising therapeutic target for precise treatment of NSCLC.


Conflict of interest statement

Competing interests: The authors declare no competing interests. Ethics approval and consent to participate: Tumor collection and analyses were conducted with the approval of the Committee on Ethics of Medicine of Naval Medical university. All patients gave written informed consent before participation in this study. Animal experiments were performed with approved ethics from the Animal Care and Use Committee of Fudan University (20160225-016). All methods were performed in accordance with the relevant guidelines and regulations.

Figures
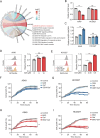
Fig. 1
Fig. 1. Glutathione metabolism is elevated in EGFR-TKI resistant NSCLC cells.
A Chord plot analysis of GO terms and KEGG pathways between gefitinib-resistant and gefitinib-sensitive cells. Relative GSH level (B) and NADP + /NADPH ratio (C) of A549 and HCC827 cells treated with or without gefitinib. (A549: 0 μM, 5 μM, 10 μM; HCC827: 0 μM, 0.05 μM, 0.5 μM). ROS production in gefitinib-treated A549 (D) and HCC827 (E) cells. The effect of GSH supplementation on gefitinib sensitivity in A549 (F) and HCC827 (G) cells was monitored continuously by ECIS model 9600. The effect of buthionine sulfoximine (BSO) treatment on gefitinib sensitivity in A549 (H) and HCC827 (I) cells. *P < 0.05, **P < 0.01, ***P < 0.001, ns no significance.
Fig. 2
Fig. 2. Loss of GPX2 mitigates EGFR-TKI resistance.
A Differential gene analysis in the glutathione metabolic pathway of gefitinib-resistant and sensitive cells. B Heatmap illustrating alterations in mRNA level of the enzymes related to glutathione metabolic pathway in A549 compared to HCC827 cells. C The protein expression of GPX2 in A549 and HCC827 cells. D GPX2 protein levels at days 0, 7, 21, 28, 35 and 42 during the construction of HCC827-GR cells. Knockdown efficiency of GPX2 at mRNA (E) and protein level (F) in A549 and HCC827-GR cells. G IC50 measurement of gefitinib after scramble or GPX2 shRNA was stably transfected into A549 and HCC827-GR cells. H Measurement of GSH level in A549 and HCC827-GR cells transfected with scramble or GPX2 shRNA at different concentrations of gefitinib treatment. I NADP + /NADPH ratio was measured in A549 and HCC827-GR cells transfected with scramble or GPX2 shRNA under gefitinib treatment. J Representative computed tomography imaging with TKI-responsive or non-responsive lung cancer patients before and after treatment. Red arrows represent the primary tumor. K IHC staining of GPX2 expression and Ki67 expression in TKI-response or nonresponse lung cancer tissues. Scale bar, 50 µm. **P < 0.01, ***P < 0.001, ns no significance.
Fig. 3
Fig. 3. GPX2 enhances CSC characteristics in EGFR-TKI resistant cells.
A Bubble plot depicting GSEA analysis of gene sets in lung cancer tissues with high or low GPX2 expression from TCGA database. B CD133 and ALDH1A1 expression levels in TKI-resistant cells after GPX2 depletion. C Scatter plot showing the correlation between GPX2 and CD133 or ALDH1A1 in the TCGA dataset. D Immunofluorescence detection of ALDH1A1 (green) expression in A549 and HCC827-GR cells. Scale bar, 20 µm. E Sphere formation ability of gefitinib-treated A549 and HCC827-GR cells under GPX2 knockdown. Scale bar, 100 µm. *P < 0.05, **P < 0.01, and ***P < 0.001, ns no significance.
Fig. 4
Fig. 4. GPX2 promotes cancer stemness by activating the Sonic Hedgehog signaling pathway.
A The effect of different signaling pathway inhibitors on cellular viability. Rob, Robotnikinin; Vert, Verteporfin. B GLI1, CD133 and ALDH1A1 expression after addition of 20(S)-OHC in GPX2 knockdown cells. C, D Immunofluorescence staining of GLI1 distribution after replenishing 20(S)-OHC in scramble or GPX2 shRNA transfected A549 and HCC827-GR cells. Scale bar, 20 µm. 20(S)-OHC treatment rescued the decline in the sphere formation efficiency led by the combination of GPX2 shRNA with gefitinib (E) or osimertinib (F). *P < 0.05, **P < 0.01, ***P < 0.001, ns no significance.
Fig. 5
Fig. 5. GPX2 augments the Sonic Hedgehog pathway via accelerating ROS scavenging.
A ROS production in gefitinib-treated A549 and HCC827-GR cells transfected with scramble or GPX2 shRNA in the presence or absence of ROS scavenger (NAC). B Quantitative analysis of ROS production. C GLI1, CD133 and ALDH1A1 expression in GPX2-knockdown A549 and HCC827GR cell lines treated with NAC. D Cell viability was detected for evaluating the effect of supplementation with NAC or Rob on GPX2 silence-induced resensitization to gefitinib in EGFR-TKI resistant cells. E The effect of NAC or Rob on GPX2 silence-induced resensitization to osimertinib in EGFR-TKI resistant cells. ***P < 0.001, ns no significance.
Fig. 6
Fig. 6. METTL14-mediated m6A modification decreases GPX2 mRNA stability in TKI-resistant cells.
A Predicted m6A site in GPX2 mRNA from overlapping results of SRAMP and RMBase v2.0. B GPX2 and METTL14 expressional analysis in normal versus tumor lung tissues from TCGA database. C Kaplan-Meier analysis of overall survival in lung cancer patients with high or low GPX2/METTL14 expression levels from TCGA database. D MeRIP analysis of m6A modification on GPX2 in METTL14 overexpressed A549 and HCC827-GR cells. E The effect of METTL14 overexpression on GPX2 mRNA level in gefitinib-resistant cell lines. F GPX2 expressional analysis in cells overexpressing METTL14 under actinomycin D (5 μg/mL) treatment for 0, 3 and 6 hours. G The effect of GPX2 and METTL14 on GLI1 and ALDH1A1 expression in gefitinib-resistant cells. H Co-expressional analysis of GPX2 with SHH, GLI1, CD133, ALDH1A1 and METTL14. I The effect of GPX2 and METTL14 on gefitinib sensitivity. J The effect of GPX2 and METTL14 on osimertinib sensitivity. *P < 0.05, ***P < 0.001, ns no significance.
Fig. 7
Fig. 7. Targeting GPX2 mitigates EGFR-TKI resistance in vivo.
A Schematic overview illustrating the establishment and treatment of CDX model. B Tumor size was measured every 2 days. C Representative images of tumors tissues from the CDX model. D Tumor weight of each group at the end point. GSH level (E) and NADP + /NADPH ratio (F) of tumor tissues in different treatment groups were detected. G Immunohistochemical staining of GPX2, GLI1 and CD133. Scale bar, 50 µm. H Scoring for immunohistochemical staining was calculated. ***P < 0.001.

References

    1. Herbst RS, Morgensztern D, Boshoff C. The biology and management of non-small cell lung cancer. Nature. 2018;553:446–54. - PubMed
    1. Kobayashi S, Boggon TJ, Dayaram T, Janne PA, Kocher O, Meyerson M, et al. EGFR mutation and resistance of non-small-cell lung cancer to gefitinib. N Engl J Med. 2005;352:786–92. - PubMed
    1. Cross DA, Ashton SE, Ghiorghiu S, Eberlein C, Nebhan CA, Spitzler PJ, et al. AZD9291, an irreversible EGFR TKI, overcomes T790M-mediated resistance to EGFR inhibitors in lung cancer. Cancer Discov. 2014;4:1046–61. - PMC - PubMed
    1. Passaro A, Janne PA, Mok T, Peters S. Overcoming therapy resistance in EGFR-mutant lung cancer. Nat Cancer. 2021;2:377–91. - PubMed
    1. Tang ZH, Lu JJ. Osimertinib resistance in non-small cell lung cancer: Mechanisms and therapeutic strategies. Cancer Lett. 2018;420:242–6. - PubMed

MeSH terms