. 2025 Jun 18;16(1):5295.
doi: 10.1038/s41467-025-60567-x.

Combinatorial discovery of microtopographical landscapes that resist biofilm formation through quorum sensing mediated autolubrication

Affiliations

Combinatorial discovery of microtopographical landscapes that resist biofilm formation through quorum sensing mediated autolubrication

Manuel Romero et al. Nat Commun. .

Abstract

Bio-instructive materials that intrinsically inhibit biofilm formation have significant anti-biofouling potential in industrial and healthcare settings. Since bacterial surface attachment is sensitive to surface topography, we experimentally surveyed 2176 combinatorially generated shapes embossed into polymers using an unbiased screen. This identified microtopographies that, in vitro, reduce colonization by pathogens associated with medical device-related infections by up to 15-fold compared to a flat polymer surface. Machine learning provided design rules, based on generalisable descriptors, for predicting biofilm-resistant microtopographies. On tracking single bacterial cells we observed that the motile behaviour of Pseudomonas aeruginosa is markedly different on anti-attachment microtopographies compared with pro-attachment or flat surfaces. Inactivation of Rhl-dependent quorum sensing in P. aeruginosa through deletion of rhlI or rhlR restored biofilm formation on the anti-attachment topographies due to the loss of rhamnolipid biosurfactant production. Exogenous provision of N-butanoyl-homoserine lactone to the rhlI mutant inhibited biofilm formation, as did genetic complementation of the rhlI, rhlR or rhlA mutants. These data are consistent with confinement-induced anti-adhesive rhamnolipid biosurfactant 'autolubrication'. In a murine foreign body infection model, anti-attachment topographies are refractory to P. aeruginosa colonization. Our findings highlight the potential of simple topographical patterning of implanted medical devices for preventing biofilm associated infections.


Conflict of interest statement

Competing interests: The authors declare no competing interests.

Figures

Fig. 1
Fig. 1. Bacterial attachment to Topochip microtopographies.
a Bacterial attachment assay procedure. Created in BioRender. Bernard, M. (2025) https://BioRender.com/6frm99i. b Ranking of topographies according to the mean fluorescence intensity per TopoUnit after P. aeruginosa and S. aureus attachment to PS TopoChips after 4-h incubation (n = 22 and n = 6 respectively). The error bars represent one standard deviation. The dotted line corresponds to the mean fluorescence value of the flat surface control for each species. c Mean fluorescence intensities from P. aeruginosa versus S. aureus for each PS TopoUnit. For Fig. 1b, c, the source data are provided as a Source Data file.
Fig. 2
Fig. 2. Machine learning modelling results for pathogen attachment using Random Forest.
a Plot of the predicted versus measured average attachment values for one run of the P. aeruginosa test set, b Regression model performance metric results for P. aeruginosa training and test sets, P. aeruginosa descriptors ranked by their importance from top to bottom and how their value (high = yellow or low = purple) impacts on the model (positive or negative impact), d Feature coverage descriptor distribution against attachment for P. aeruginosa, e Scatter plot of the measured against predicted average attachment values for one run of the S. aureus test set, f Regression model performance metric results for the S. aureus training and test sets, g S. aureus descriptor importance and their impact on model output. The topographical descriptors found to be most important for bacterial attachment are the inscribed circle which relates to the space between primitives, the total area covered by features (feature coverage) and the maximum feature radius, h Feature coverage descriptor distribution against attachment for S. aureus, i Comparison between P. aeruginosa attachment and the engineered roughness index (ERI) calculated for the topographies investigated, j Comparison between S. aureus attachment and the roughness index calculated for the topographies. The source data are provided as a Source Data file.
Fig. 3
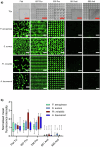
Fig. 3. Attachment of bacterial pathogens to flat, pro- (Topo-Units 697 and 336) and anti-attachment (881 and 685) PS.
a Representative images of P. aeruginosa, S. aureus, Pr. mirabilis and A. baumannii attachment (bright field images of the TopoUnits shown in top row) after 4 h incubation under static conditions. Scale bar: 50 µm. b Quantification of normalised mean fluorescence intensity of bacterial cells stained with Syto9 and grown on the same topographies (P. aeruginosa n = 22 TopoUnits, S. aureus n = 6 TopoUnits, Pr. mirabilis n = 12 TopoUnits and A. baumannii n = 16 TopoUnits). Data shown in boxes extend from the 25th to 75th percentiles and lines in boxes correspond to the median values. Whiskers go down to the smallest and up to the largest values. Statistical analysis was done using a two-way ANOVA with Dunnett’s multiple comparisons test (*p < 0.05; **p < 0.01; ***p < 0.001; **** p < 0.0001). P-values for 881 and 685 topographies are: P. aeruginosa = 1.28E−12 and 7.05E−13, S. aureus = 0.00032 and 0.0011, Pr. mirabilis = 9.25E07 and 3.22E−07, A. baumannii = 2.72E−09 and 6.37E−11. The source data are provided as a Source Data file.
Fig. 4
Fig. 4. Bacterial attachment comparing different materials, inversion and flow.
a Representative images of P. aeruginosa wildtype stained with Syto9 fluorescent dye (green) or P. aeruginosa wild type transformed with mCherry (red; on PU only) grown for 4 h on flat, pro- or anti-attachment TopoUnits (bright field images shown in top row) moulded from PS, PU or cyclic olefin copolymer (COC). P. aeruginosa wildtype attachment on upside down oriented TopoUnits (inverted) and under flow conditions is shown for PS TopoUnits. Scale bar: 50 µm. b Quantification of normalised mean fluorescence intensity of wildtype P. aeruginosa incubated under conditions described above (PS: n = 22 TopoUnits, PS Flow: n = 4 TopoUnits, PS Inverted: n = 5 TopoUnits, COC: n = 12 TopoUnits and PU: n = 8 TopoUnits). Statistical analysis was done using a two-way ANOVA with Dunnett’s multiple comparisons test (*p < 0.05; **p < 0.01; ***p < 0.001; ****p < 0.0001). P-values for 881 and 685 topographies are: PS < 1.00E−15 and <1.00E−15, PS Flow = 2.40E−06 and 6.23E−9, PS Inverted = 7.84E−06 and 2.41E−05, COC = 3.37E−13 and 7.46E−13, PU < 1.00E15 and <1.00E−15. c Bacterial biofilm assessment: Representative images of P. aeruginosa and S. aureus biofilms on flat, pro and anti-attachment PS topographies after 24 h incubation under static conditions. Scale bar: 50 µm. d Quantification of mean normalised fluorescence intensity for wildtype P. aeruginosa and S. aureus biofilms shown in c. P. aeruginosa n = 32 TopoUnits, S. aureus n = 24 TopoUnits. Data shown in boxes extend from the 25th to 75th percentiles and lines in boxes correspond to the median values. Whiskers go down to the smallest and up to the largest values. Statistical analysis was done using a two-way ANOVA with Dunnett’s multiple comparisons test (* p < 0.05; ** p < 0.01; *** p < 0.001; **** p < 0.0001). P-values for 881 and 685 topographies are: P. aeruginosa = 2.22E−13 and 2.22E−13, S. aureus = 5.29E−10 and 1.08E−10. For Fig. 4a, d, the source data are provided as a Source Data file.
Fig. 5
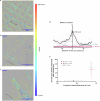
Fig. 5. Differential interference contrast (DIC) microscopy of P. aeruginosa cells within 2 min of inoculation, tracked over 20 s (frames captured at 20 ms intervals) for 2 min and converted into lines representing the path of an individual cell.
Overlays of individual cell tracks on a anti-attachment TopoUnit 881, b pro-attachment TopoUnit 697 and c flat control on a single frame with yellow lines indicating the positions of the subtracted topographical features (scale bars, 20 µm). Track speed is indicated by line colour. Black double-headed arrows indicate the directionality of the cells relative to the 2 µm wide channels in TopoUnit 881. d Number of tracks and their directionality after 2 min incubation on 881 (black), 697 (magenta) and flat control (green) surfaces respectively. e The proportion of stationary surface associated cells after 2 min correlates with subsequent bacterial attachment (fluorescence intensity; AU, arbitrary units) after 4 h incubation. Data shown are mean ± SD. n = 739, 813 and 809 single bacterial cells respectively tracked on flat, pro-attachment (TopoUnit 697) and anti-attachment (TopoUnit 881) surfaces. For Fig. 5d, e, the source data are provided as a Source Data file.
Fig. 6
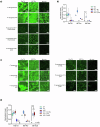
Fig. 6. Mutation of flagella, T4P, wsp signalling or overexpression of the diguanylate cyclase yedQ do not facilitate colonization of anti-attachment TopoUnits.
Representative fluorescent images a and normalized mean fluorescence intensities b of P. aeruginosa wildtype, ΔpilA and ΔfliC cells attached to flat, pro and anti-attachment PS topographies after 4 h incubation (WT: n = 22 TopoUnits, pilA: n = 6 TopoUnits, fliC: n = 9 TopoUnits). Statistical analysis was done using a two-way ANOVA with Dunnett’s multiple comparisons test (*p < 0.05; **p < 0.01; ***p < 0.001; ****p < 0.0001; ns not significant). P-values WT vs pilA: Flat 0.0015, 1556 0.17 and 685 0.98. P-values WT vs fliC: Flat 1.72E-05, 1556 0.041 and 685 0.99. Scale bar: 50 µm. Representative images c and normalized mean fluorescence intensity d of P. aeruginosa wildtype, ΔwspF and the wild type expressing yedQ (pyedQ) on flat (n = 16 TopoUnits), pro (n = 10 TopoUnits) and anti-attachment (n = 7 TopoUnits) surfaces after 24 h incubation under static conditions. Data shown in boxes extend from the 25th to 75th percentiles and lines in boxes correspond to the median values. Whiskers go down to the smallest and up to the largest values. Scale bar: 50 µm. For Fig. 6b, d, the source data are provided as a Source Data file.
Fig. 7
Fig. 7. Quorum sensing dependent rhamnolipid production prevents biofilm formation on anti-attachment TopoUnits.
Representative fluorescent images a and normalized mean fluorescence intensities b of P. aeruginosa wildtype and ΔrhlA without or with exogenous rhamnolipids and with ΔrhlA genetically complemented with rhlA on flat (n = 20 TopoUnits), pro (n = 9 TopoUnits) and anti-attachment (n = 9 TopoUnits) surfaces after 24 h incubation under static conditions. Data shown in boxes extend from the 25th to 75th percentiles and lines in boxes correspond to the median values. Whiskers go down to the smallest and up to the largest values. Statistical analysis was done using a two-way ANOVA with Dunnett’s multiple comparisons test (*p < 0.05; **p < 0.01; ***p < 0.001; ****p < 0.0001). P-value WT vs rhlA on the 881 topography = 6.54E−13. Representative images c and normalized mean fluorescence intensity d of P. aeruginosa wildtype, ΔrhlI without or with exogenous C4-HSL, ΔrhlI genetically complemented with rhlI, ΔrhlR and ΔrhlR genetically complemented with rhlR on flat (n = 20 TopoUnits), pro (n = 4 TopoUnits) and anti-attachment (n = 16 TopoUnits) surfaces after 24 h incubation under static conditions. Data shown in boxes extend from the 25th to 75th percentiles and lines in boxes correspond to the median values. Whiskers go down to the smallest and up to the largest values. Statistical analysis was done using a two-way ANOVA with Dunnett’s multiple comparisons test (* p < 0.05; ** p < 0.01; *** p < 0.001; **** p < 0.0001). P-value WT vs rhlI and rhlR on the 881 topography < 1.00E−15. Scale bar: 50 µm. For Fig. 7b, d, the source data are provided as a Source Data file.
Fig. 8
Fig. 8. Colonization of pro- (697) and anti- (881) attachment PU TopoUnits compared with flat PU implanted subcutaneously in mice.
After implantation, mice were allowed to recover for 4 days prior to infection with P. aeruginosa for a further 4 days. The implants were recovered and imaged via confocal fluorescence microscopy. a Representative images of P. aeruginosa PAO1 pcE2C (red) constitutively expressing the fluorescent protein E2Crimson. Upper panels, scale bar 50 µm; Lower panels, fluorescent images overlaid on brightfield images; scale bar, 20 µm. b Quantification of P. aeruginosa pcE2C surface coverage from individual explants (one per mouse) using constitutive E2C fluorescence. TopoUnits 881 (n = 8 mice) and 697 (n = 7 mice; one implant was unrecoverable) were compared with Flat PU (n = 8 mice). Statistical analysis was done using one way ANOVA with Tukey’s multiple comparison test. 697 vs 881, p = <0.0001 ****; flat vs 881, p = <0.0001 ****; flat vs 697 p = 0.9328, NS, not significant. The source data are provided as a Source Data file. c Representative images of explanted TopoUnits 881 and 697 stained for bacteria and host cells. Lefthand panels: orange, PAO1 bacteria detected using IHC antibody PA1-73116 and secondary anti-rabbit Alexa 555. Righthand panels: brightfield images of the lefthand panels stained in addition with DAPI (for DNA nuclei, blue) and FM1-43 (for cell membranes, green). Scale bars, 10 μm. d Sterile explant recovered after 4 days showing increased host cell migration on the upper side of TopoUnit 881 compared with the flat side indicative of an asymmetrical host response. Blue, DAPI, DNA stained nuclei (blue), FM1-43 stained membranes, green. Scale bar, 100 μm.

References

    1. Sauer, K. et al. The biofilm life cycle: expanding the conceptual model of biofilm formation. Nat. Rev. Microbiol.20, 608–620 (2022). - PMC - PubMed
    1. Flemming, H. C. et al. Biofilms: an emergent form of bacterial life. Nat. Rev. Microbiol.14, 563–575 (2016). - PubMed
    1. Tolker-Nielsen, T. Biofilm development. Microbiol. Spectr.3, MB-0001–MB-2014 (2015). - PubMed
    1. Laventie, B. J. & Jenal, U. Surface sensing and adaptation in bacteria. Annu. Rev. Microbiol.74, 735–760 (2020). - PubMed
    1. Park, S. & Sauer, K. Controlling biofilm development through cyclic di-GMP signaling. Adv. Exp. Med. Biol.1386, 69–94 (2022). - PMC - PubMed

MeSH terms

LinkOut - more resources