

Review
doi: 10.1038/s41531-025-01004-0.
Imaging advances to detect non-motor prodromal markers of Parkinson's disease and explore therapeutic translation opportunities
Affiliations
- PMID: 40533452
- PMCID: PMC12177059
- DOI: 10.1038/s41531-025-01004-0
Item in Clipboard
Review
Imaging advances to detect non-motor prodromal markers of Parkinson's disease and explore therapeutic translation opportunities
NPJ Parkinsons Dis.
.
Abstract
Parkinson's disease (PD) is a progressive neurological disorder marked by late-emerging motor symptoms, but early non-motor signs like hyposmia and REM sleep behavior disorder may precede diagnosis by years. Identifying non-motor biomarkers during this prodromal phase could predict phenoconversion and enable early interventions. This narrative review outlines key prodromal non-motor symptoms, summarizes imaging technologies for early detection, and explores their translational potential in guiding timely, neuroprotective therapies for at-risk individuals.
© 2025. The Author(s).
Conflict of interest statement
Competing interests: The authors declare no competing interests.
Figures
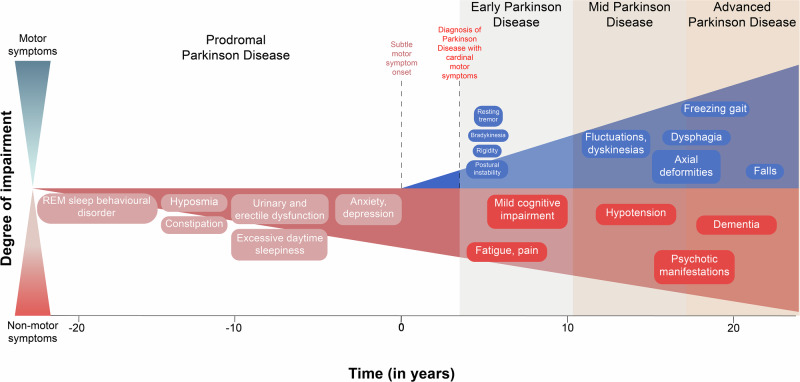
Graphical representation of the overall timeline of PD, beginning from the prodromal phase characterized by non-motor symptoms up to 20 years before start of motor deficits, through the three distinct stages of PD (early, mild and advanced stages).
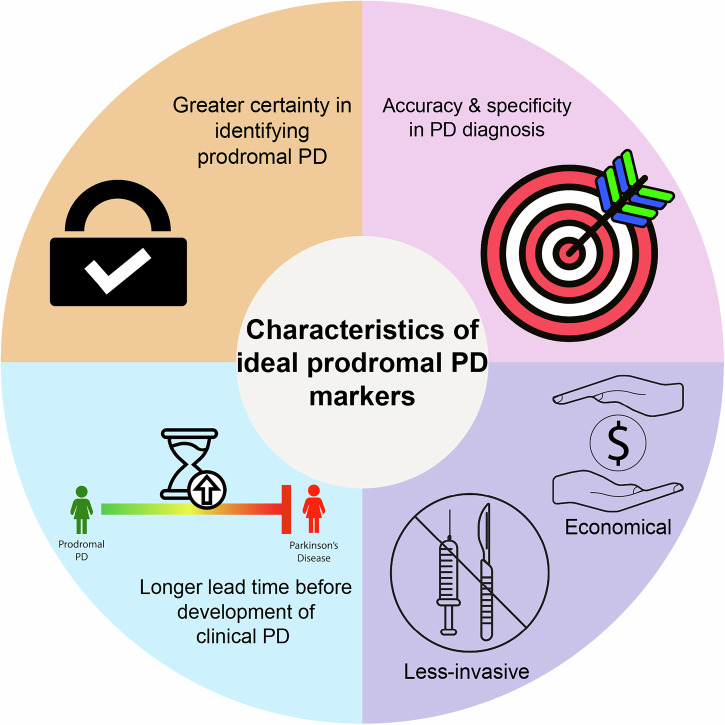
The key markers of prodromal PD should include a greater predictive confidence in identifying early stages of PD, accuracy and specificity in diagnosing PD, a longer duration between the identification of the markers and onset of clinical symptoms, cost-effectiveness, and reduced invasiveness.
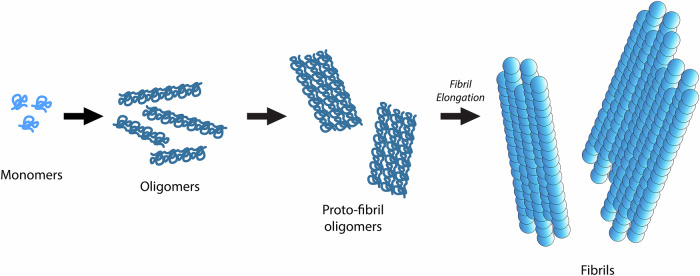
The schematic delineates the progression of ɑ-syn monomers into oligomers, proto-fibril oligomers, and elongation into fibrils during the process of misfolding and aggregation.
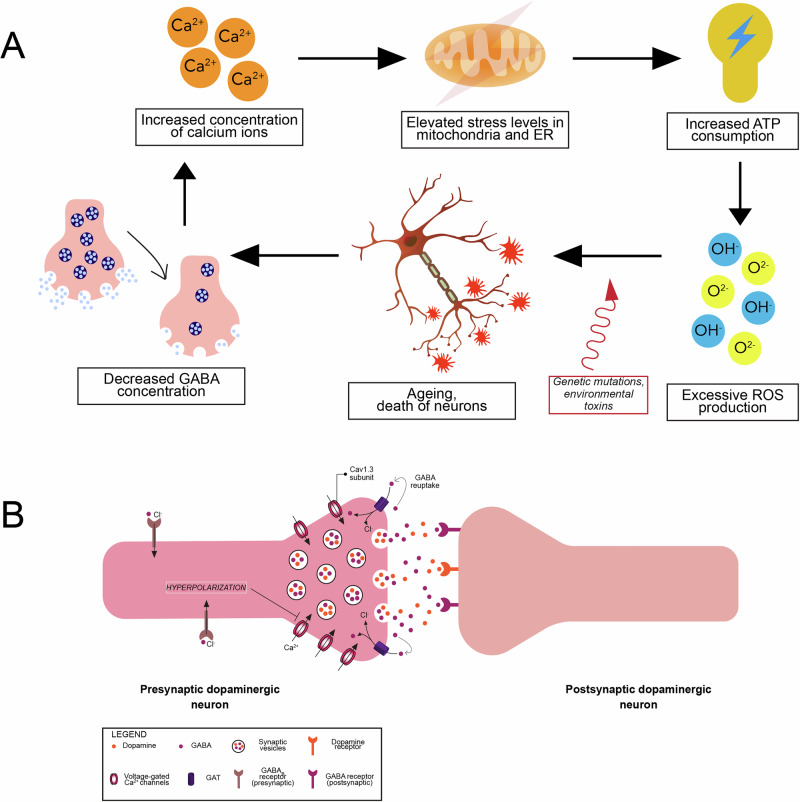
A Increased intracellular Ca2+ levels trigger a molecular cascade, culminating in ageing and death of dopaminergic neurons, and an eventual depletion in GABA release by the neurons. Genetic polymorphisms and environmental factors may accelerate ageing and death of the neurons. Decrease in GABA levels further increase intracellular Ca2+ levels in a positive feedback manner. B Co-release of GABA and dopamine neurotransmitters from the presynaptic terminal of a dopaminergic neuron in response to Ca2+ influx via VGCCs with a constituent Cav1.3 subunit. Re-uptake of GABA by presynaptic GAT and GABAB receptors induces a hyperpolarization, ultimately obstructing VGCCs from further Ca2+ influx. Key: ATP – adenosine triphosphate; ER – endoplasmic reticulum; GABA – γ-aminobutyric acid; GAT – GABA transporter; ROS – reactive oxygen species; VGCC – voltage-gated Ca2+ channel.
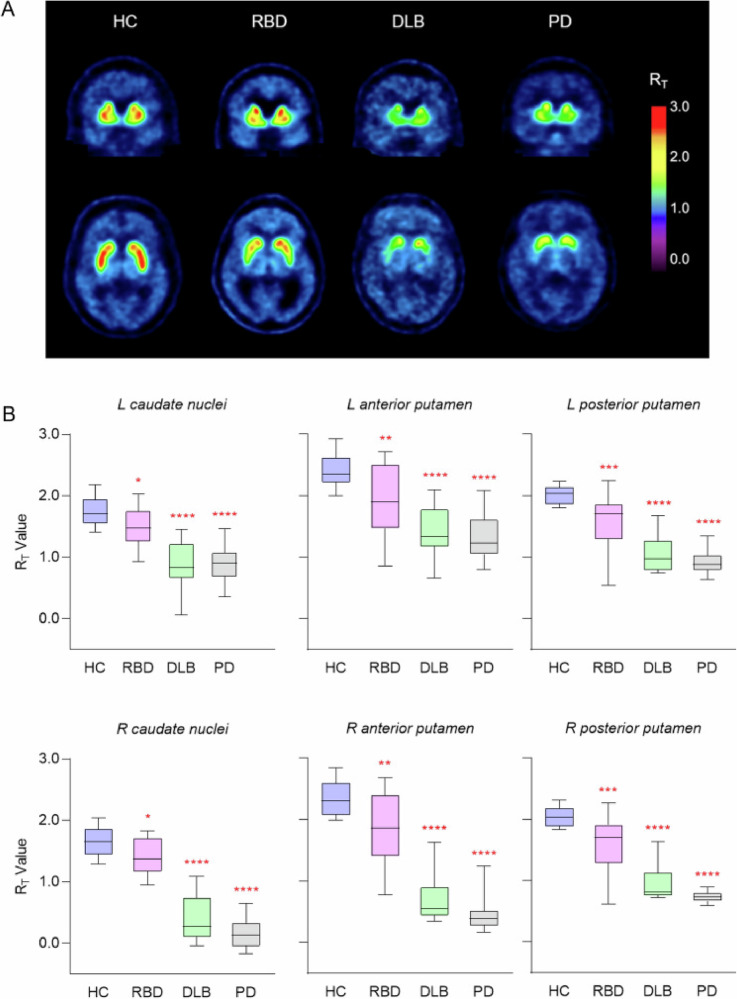
A Representative [18F]-AV-133 PET tissue ratio (RT) images. RT values for region of interests were computed using the primary visual cortex, a region comparatively lacking monoaminergic terminals, as a reference region. B [18F]-AV-133 PET RT values from volumes of interest analysis represented as box-and-whisker plots. Box lines represent median and interquartile range, while whiskers represent minimum and maximum values. *Significantly different from HC. *P < 0.05, **P < 0.01, ***P < 0.005, ****P < 0.0001. Key: DLB – Dementia with Lewy Bodies; HC- healthy control; L – Left; PD – Parkinson’s Disease; R – Right; RBD – REM sleep behavioral disorder. (Figure adapted with permission from “Reduced striatal vesicular monoamine transporter 2 in REM sleep behaviour disorder: imaging prodromal parkinsonism”, by Beauchamp L.C. et al., 2020, Nat. Sci. Rep.).
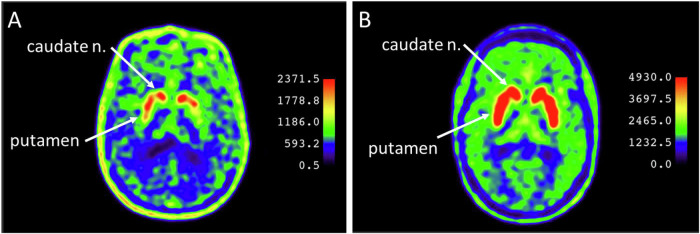
A Pronounced interhemispheric asymmetry of 18F-DOPA accumulation in putamen of patient with Unified Parkinson’s Disease Rating Scale (UPDRS) of 3.5 (B) Absence of interhemispheric asymmetry of 18F-DOPA accumulation in striatum of patient with UPDRS of 1. (Figure adapted with permission from “Dopamine Synthesis in the Nigrostriatal Dopaminergic System in Patients at Risk of Developing Parkinson’s Disease at the Prodromal Stage”, by Blokhin V. et al., 2024, Journal of Clinical Medicine).
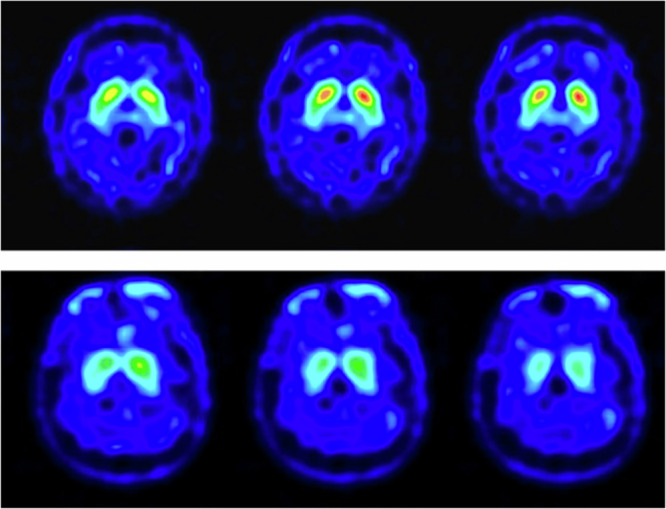
Upper row images: 64 year old male patient with no definite presynaptic dopaminergic lesion. Lower row images: 49 year old female patient with uniform pattern of loss in radioactivity in the striatum which potentially more dominant over the right side. (Figure adapted with permission from “Cortical excitability in patients with REM sleep behaviour disorder with abnormal TRODAT-1 SPECT scan: an insight into prodromal Parkinson’s Disease”, by Su et al., 2023, Frontiers in Neurology).
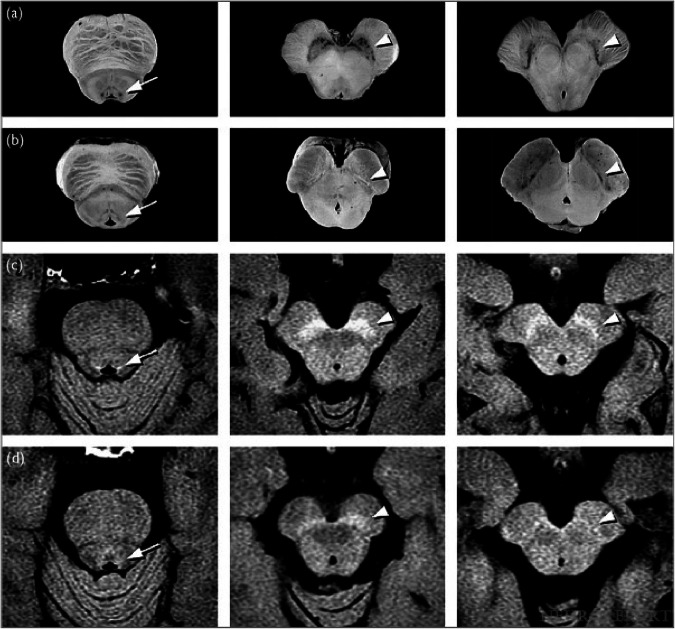
a Macroscopic specimens from the brain of an 80-year-old male cadaver without PD or other central nervous system disorder. Presence of neuromelanin in the LC (arrow) and SNpc (arrowheads) is evident. b Macroscopic specimens from the brain of a 76-year-old man with pathologically proven PD. The neuromelanin pigment of the LC (arrow) and SNpc (arrowheads) is greatly reduced owing to neuronal depletion. c Neuromelanin MRI of pons and midbrain of a 68-year-old healthy woman. Hyperintensity areas are found at locations corresponding to the LC (arrow) and SNpc (arrowheads), in close correlation with the findings in (a). d Neuromelanin MRI of pons and midbrain of a 70-year-old woman with PD. The hyperintensity areas indicating the LC (arrow) and SNpc (arrowheads) do not stand out, presumably because of decreased neuromelanin content as a result of neuronal depletion. Key: LC—locus coeruleus; MRI—Magnetic resonance imaging; PD —Parkinson’s disease; SNpc—substantia nigra pars compacta (Figure adapted with permission from “Neuromelanin magnetic resonance imaging of locus coeruleus and substantia nigra in Parkinson’s disease”, by Makoto et al., 2006, NeuroReport).
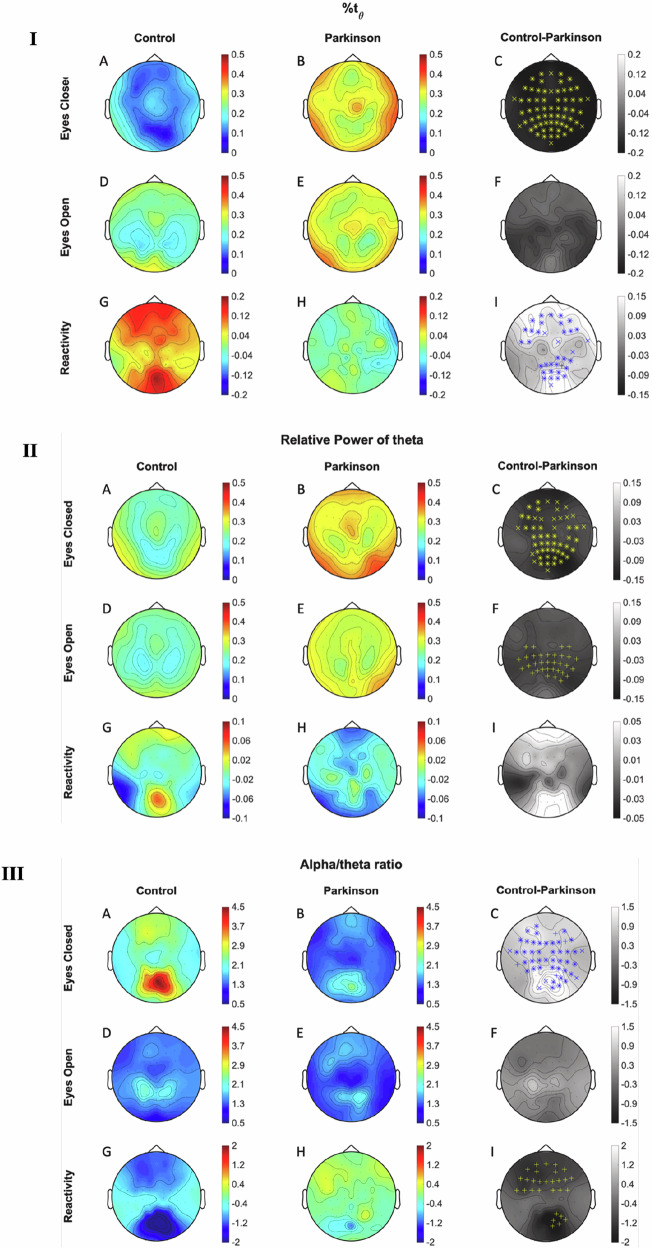
(I) Average topographic maps of time percentage with frequency in theta peak (%tθ) for healthy (A, D, G) and PD (B, E, H) subjects, and difference between these two groups (C, F, I) under different recording conditions. A, B and C illustrate maps when eyes were closed, (D, E, F) illustrate maps when eyes were open, and (G, H, I) illustrate maps during reactivity. (II) Average topographic maps of theta relative power for healthy (A, D, G) and PD (B, E, H) subjects, and difference between these two groups (C, F, I) under different recording conditions. A, B, C illustrate maps when eyes were closed, (D, E, F) illustrate maps when eyes were open, and (G, H, I) illustrate maps during reactivity. (III) Average topographic maps of alpha/theta ratio for healthy (A, D, G) and PD (B, E, H) subjects, and difference between these two groups (C, F, I) under different recording conditions. A, B, C illustrate maps when eyes were closed, D, E and F illustrate maps when eyes were open, and (G, H, I) illustrate maps during reactivity. Statistical differences are marked on the group difference topographic map, where “+” and “x” mean significant difference obtained using cluster-based permutation test and the two-stage false discovery rate method proposed by Benjamini, Krieger and Yekutieli correction., respectively, “*” means significant differences were obtained by both methods. The increasing and decreasing trend in PD is marked in blue and yellow, respectively. (Figure adapted with permission from “Early detection of Parkinson’s disease: Systematic analysis of the influence of eyes on quantitative biomarkers in resting-state electroencephalography ”, by Gimenez-Aparisi et al., 2023, Heliyon).
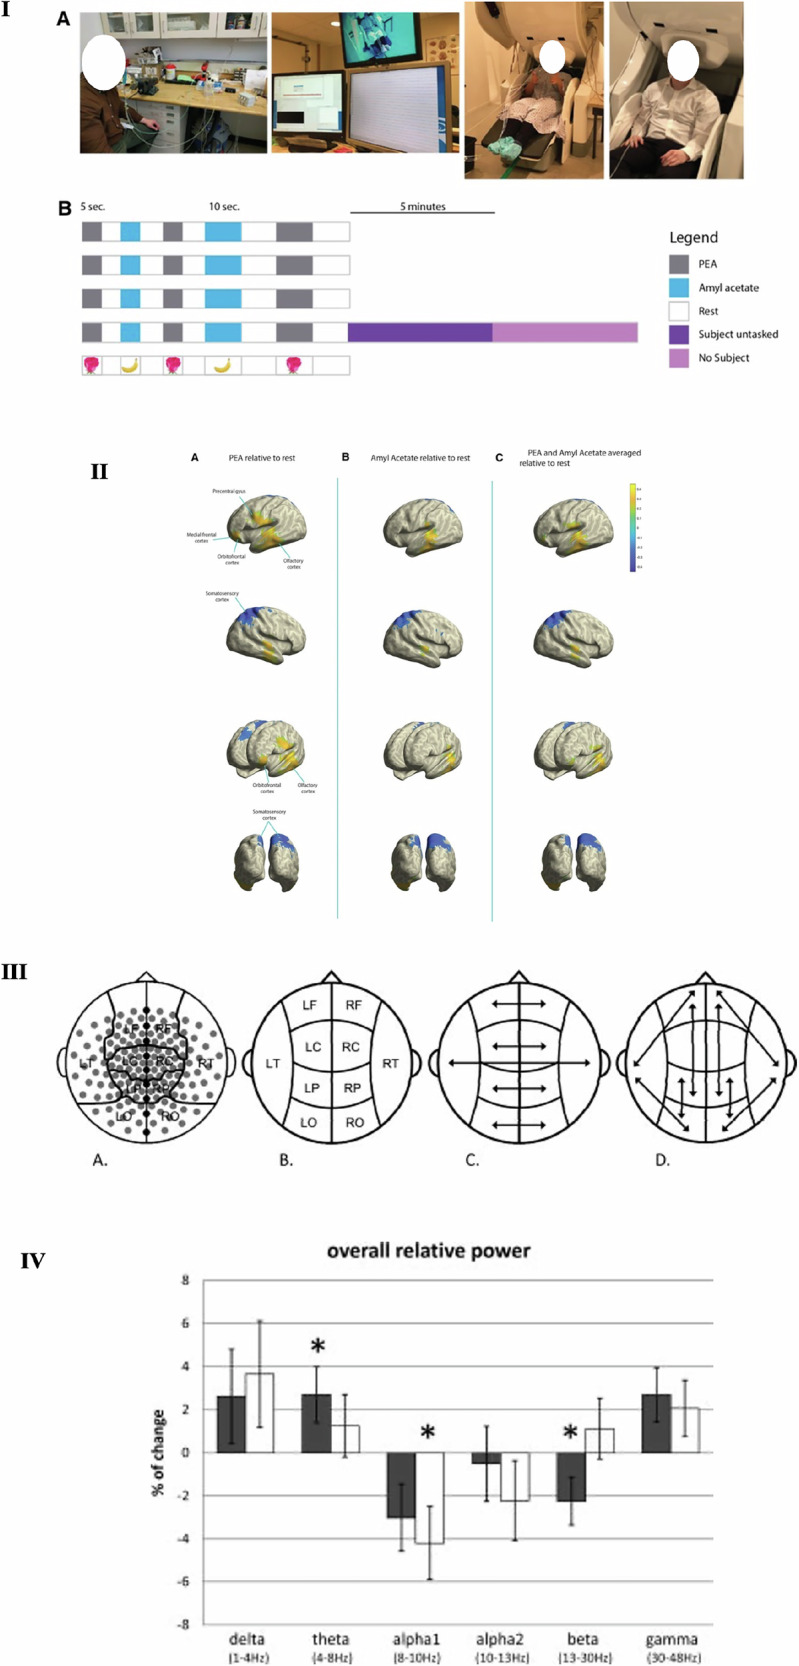
(I) (A)—Left: Depiction of main components of the olfactometer-MEG paradigm. Subject is wearing an air-sealed CPAP mask. Continuous room air is fed into one of the three open solenoid valves, triggered by a software program, at a constant flow rate. Air is fed into one of the three glass chambers containing PEA, amyl acetate or odourless mineral oil. The scented air is then fed into the CPAP mask, while being continuously removed at a constant flow rate. Middle: 306-channel -whole head MEG. Right: Subject wearing CPAP connected to olfactometer and seated with head positioned ready for MEG scanning. B Representation of software-programmed olfactory stimulus paradigm. Each row represents a “run”. Each subject was given four runs with the last run immediately followed by MEG recording of the subject untasked (i.e. asked to relax and refrain from making any sustained, voluntary movements), and without the subject present. (II) Change in relative alpha power in the olfactory, somatosensory, orbitofrontal and medial frontal cortices, and precentral gyrus. Yellow and blue indicate increases and decreases in activity respectively. A PEA stimulation relative to rest. B Amyl acetate stimulation relative to rest. C Olfactory stimulation (PEA and amyl acetate signals averaged) relative to rest. (Figure adapted with permission from “Neuromapping olfactory stimulation using magnetoencephalography—visualizing smell, a proof-of-concept study”, by Tarfa et al., 2023, Frontiers in Allergy). (III) Sensor clustering and selection of relative spectral power and SL measures. A Clustering of MEG sensors above major cortical regions with removal of midline sensors from spectral power and SL analysis. B Representation of regions of interest used to calculate spectral power and short-distance local SL. C Long-distance interhemispheric connections used to calculate SL. D Long-distance intrahemispheric connections used to calculate Sl. Arrows indicate Sl connections used. Key: L Left, R Right, F Frontal, C Central, P Parietal, O Occipital, T Temporal. (IV) Percentage of change and standard errors of the mean in relative spectral power (stimulus vs. rest conditions) for each frequency band. Grey bars, controls; white bars, PD patients. * indicates Pvalue < 0.05, when comparing all rest and stimulus epochs in a multilevel statistical model. (Figure adapted with permission from “Advanced Time-Series Analysis of MEG Data as a Method to Explore Olfactory Function in Healthy Controls and Parkinson’s Disease Patients”, by Boesveldt et al., 2009, Human Brain Mapping).
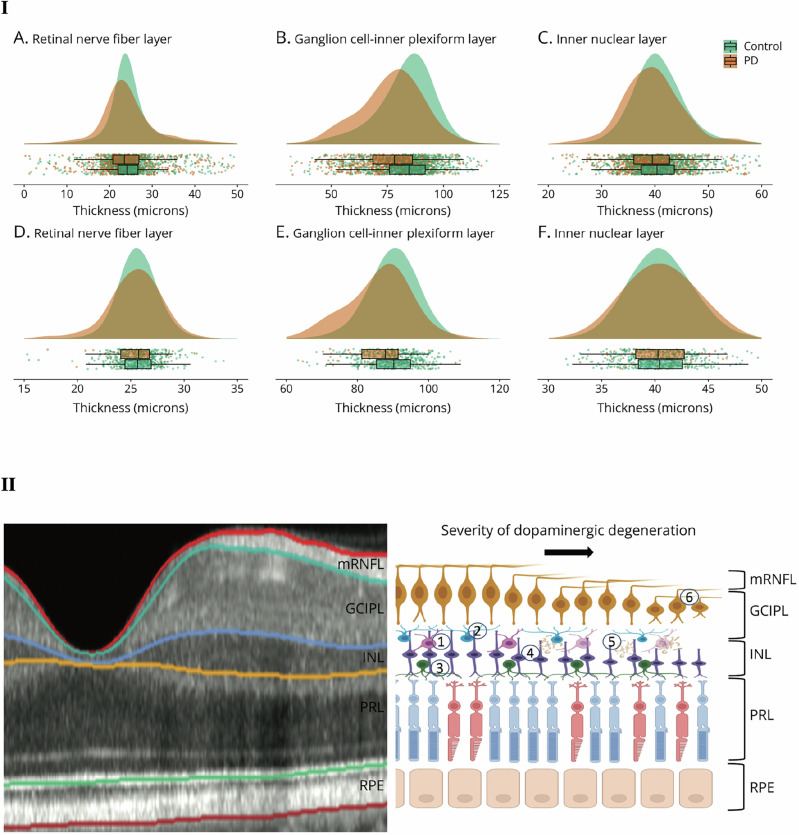
(I) Distribution of retinal sublayer thickness in the retrospective and prospective cohort. Raincloud plots comprising density, box-whisker, and scatter plots for AlzEye (A–C) and UK Biobank (D–F) for discrete retinal layers. Scatter points represent the mean of both eyes (where applicable) for each participant. (II) Illustration of distribution of different retinal cell types. An illustration of OCT scan of nasal macula adjacent to schematic depicting interactions with dopaminergic amacrine cells. Dopaminergic cells possess (1) dense plexi located throughout the inner plexiform and nuclear layers; (2) some dopaminergic processes project toward the photoreceptor layer whereby they interact with horizontal cells; (3) Dopaminergic cells are postsynaptic to bipolar cells;(4) Prior work has exemplified ɑ-syn protein aggregation within the inner nuclear layer; (5) potentially compromising function of adjacent ganglion cells. Key: GCIPL macular ganglion cellinner plexiform layer, INL inner nuclear layer, PRL photoreceptor layer, RNFL retinal nerve fibre layer, RPE retinal pigment epithelium. (Figure adapted with permission from “Retinal Optical Tomography Features Associated With Incident and Prevalent Parkinson Disease”, by Wagner et al., 2023, Neurology).
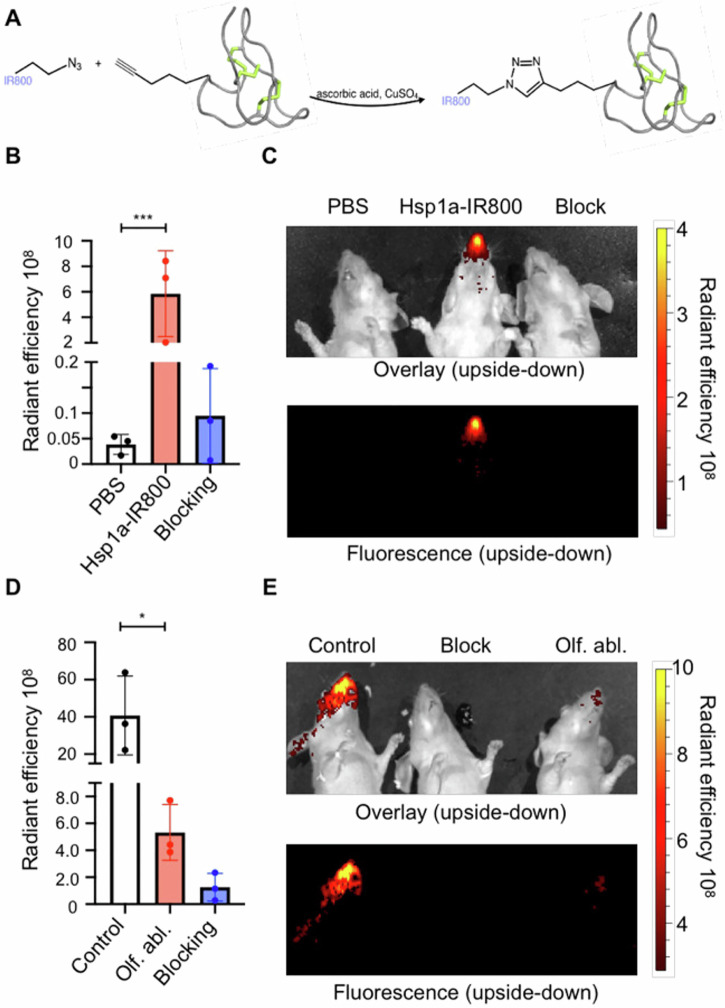
A Chemical synthesis of Tsp1a-IR800. The IR800 fluorophore with an attached zido group reacts with an alkyne group on Tsp1a to yield the fluorescent imaging agent. B, C Fluorescent intensity quantification of mice injected with PBS, Tsp1a-IR800, and Tsp1a-IR800/Tsp1a blocking formulation, and their respective epifluorescence images. D, E Fluorescent intensity quantification of mice with olfactory ablation via methimazole injected with PBS, Tsp1a-IR800, and Tsp1a-IR800/Tsp1a blocking formulation, and their respective epifluorescence images. All images were captured 30 min following tail-vein injection. (*p ≤ 0.05; **p ≤ 0.01; ***p ≤ 0.001; ****p ≤ 0.0001) (Figure adapted with permission from “Non-invasive diagnostic method to objectively measure olfaction and diagnose smell disorder by molecularly targeted fluorescent imaging agent”, by Adilbay et al., 2022, bioRxiv).
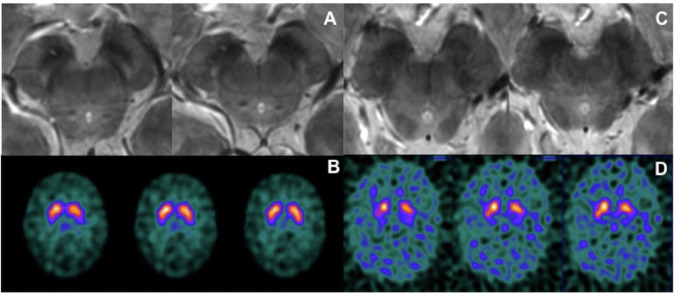
MRI and SPECT images of RBD patients with either normal (A, B) or abnormal (C, D) findings. A, C: 7 Tesla 3D gradient-recalled echo multiecho susceptibility-weighted imaging of magnetic resonance of substantia nigra; B, D: 123I-FP-CIT SPECT. (Figure adapted with permission from “Seven tesla MRI of the substantia nigra in patients with rapid eye movement sleep behavior disorder”, by Frosini et al., 2017, Parkinsonism and Related Disorders).
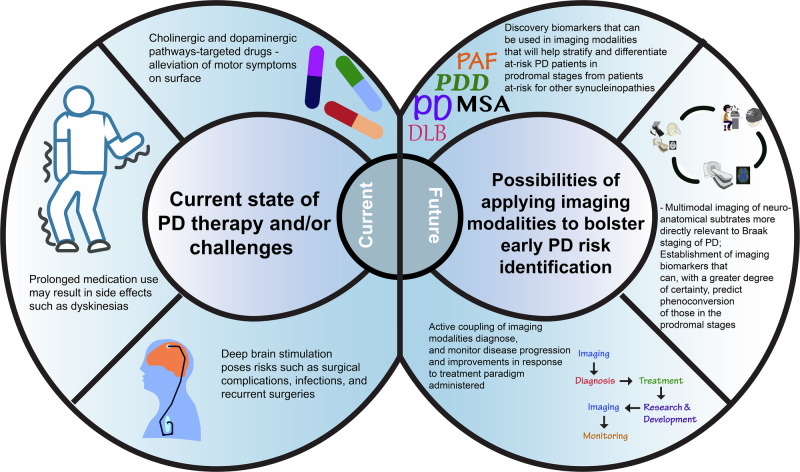
The current state of therapy (left-hand side of figure) outlines the current therapuetic management measures and treatment paradigm, alongside the challenges that they pose. The future outlook (right-hand side) outlines how the imaging advances highlighted in this review could potentially support early PD risk identification.
Similar articles
-
Use of β-adrenoreceptor drugs and Parkinson's disease incidence in women from the French E3N cohort study.J Parkinsons Dis. 2025 Jun;15(4):789-804. doi: 10.1177/1877718X251330993. Epub 2025 Apr 29. J Parkinsons Dis. 2025. PMID: 40302366
-
Safety and tolerability of intravenous liposomal GM1 in patients with Parkinson disease: A single-center open-label clinical phase I trial (NEON trial).PLoS Med. 2025 May 13;22(5):e1004472. doi: 10.1371/journal.pmed.1004472. eCollection 2025 May. PLoS Med. 2025. PMID: 40359409 Free PMC article. Clinical Trial.
-
Enhancing the diagnostic potential of electroretinography in Parkinson's disease: A review of protocol and cohort criteria.J Parkinsons Dis. 2025 Jun;15(4):694-709. doi: 10.1177/1877718X251331863. Epub 2025 Apr 29. J Parkinsons Dis. 2025. PMID: 40530583 Review.
-
Incidence of antiepileptic drug use in Parkinson's disease.J Parkinsons Dis. 2025 Jun;15(4):780-788. doi: 10.1177/1877718X251343079. Epub 2025 May 23. J Parkinsons Dis. 2025. PMID: 40405650
-
Opportunities and Pitfalls of REM Sleep Behavior Disorder and Olfactory Dysfunction as Early Markers in Parkinson's Disease.J Parkinsons Dis. 2024;14(s2):S275-S285. doi: 10.3233/JPD-230348. J Parkinsons Dis. 2024. PMID: 38517805 Free PMC article. Review.
References
-
- Golan, H., Volkov, O. & Shalom, E. Nuclear imaging in Parkinson’s disease: the past, the present, and the future. J. Neurol. Sci.436, 120220 (2022). - PubMed
Publication types
LinkOut - more resources
Full Text Sources
