. 2025 Jun 19;16(1):460.
doi: 10.1038/s41419-025-07782-y.

PUMA reduces FASN ubiquitination to promote lipid accumulation and tumor progression in human clear cell renal cell carcinoma

Affiliations

PUMA reduces FASN ubiquitination to promote lipid accumulation and tumor progression in human clear cell renal cell carcinoma

Qianqian Luo et al. Cell Death Dis. .

Abstract

While the p53 upregulated modulator of apoptosis (PUMA) is traditionally recognized for promoting cell apoptosis and enhancing chemotherapy efficacy in various cancers, its role in clear cell renal cell carcinoma (ccRCC) remains unclear due to ccRCC's chemotherapy resistance. In this study, we discover a novel oncogenic role for PUMA in ccRCC, diverging from its known apoptotic function, through assessments of public datasets, clinical tissue samples, and cell line experiments. Abnormally high expression of PUMA positively correlates with clinical stages and poor prognosis. Notably, PUMA's role in ccRCC appears to be independent of apoptosis. Instead, it facilitates tumor progression and lipid accumulation through mechanisms involving the key metabolic regulator, fatty acid synthase (FASN). Specifically, the N44-102 amino acid sequence of PUMA, distinct from the previously studied BH3 domain, is crucial for its interaction with FASN. As a mechanism, PUMA stabilizes FASN by binding to ubiquitin-specific protease 15 (USP15), reducing FASN ubiquitination and degradation, thereby forming the PUMA-USP15-FASN axis. These findings challenge the established view of PUMA's role in cancer biology. Furthermore, PUMA knockdown significantly inhibits tumor growth and enhances the sensitivity of ccRCC tumors to metabolic inhibition. These results position PUMA as a novel metabolic regulator and a potential therapeutic target in ccRCC. The combined inhibition of PUMA and FASN further supports the therapeutic potential of targeting this metabolic axis.


Conflict of interest statement

Competing interests: The authors declare no competing interests. Ethics approval and Consent to participate: (a) All methods in this study were performed in accordance with the relevant guidelines and regulations. (b) For animal experiments, approval was obtained from the Institutional Animal Care and Use Committee (IACUC) of Huazhong University of Science and Technology with approval number 3617. For human studies, approval was obtained from the Institutional Ethics Committee (IEC) of Tongji Medical College, Huazhong University of Science and Technology, Union Hospital with the reference number 0847. (c) Informed consent was obtained from all participants involved in the human studies. (d) No identifiable images from human research participants were included in this study.

Figures
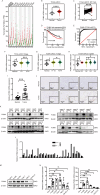
Fig. 1
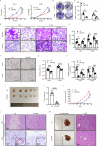
Fig. 1. High expression of PUMA in ccRCC correlates positively with clinical stages.
A A dot map illustrates PUMA gene expression in 11 cancer types. Red dots denote tumor tissues (T), while green dots are for the paired normal tissues (N). The fold increase in median expression for each cancer type and the sample sizes are stated as follows: KIRC (2.94, T:523, N:100), KIRP (5.49, T:286, N:60), COAD (7.75, T:275, N:349), DLBC (2.29, T:47, N:337), ESCA (3.89, T:182, N:286), HNSC (22.54, T:519, N:44), PAAD (2.71, T:179, N:171), READ (2.18, T:92, N:318), STAD (2.53, T:408, N:211), THCA (2.71, T:512, N:337), and THYM (2.29, T:118, N:339). Full names of cancer-type abbreviations are listed in Supplementary Table S3. B The comparison of mRNA expression of PUMA between ccRCC tissues (n = 534) and normal tissues (n = 72). C The mRNA expression of PUMA in 72 paired ccRCC tissue samples. Data in B and C is from TCGA-KIRC databases. D The Kaplan–Meier survival analysis on the ccRCC patients (n = 534) between high-expression and low-expression groups of PUMA. High expression was defined as PUMA mRNA levels above the median value of 7.5085 in 534 ccRCC samples, with levels below the median categorized as low expression. E The ROC analysis of PUMA mRNA expression levels was compared between ccRCC tumor tissues and normal kidney tissues using TCGA dataset analysis (AUC = 0.9418). AUC: areas under the curve. F and G The PUMA mRNA expression, compared to matched normal samples, varies across different pathological stages, as represented by a violin plot. The mean values for each group are: normal (5.787, n = 72), stages I–II (7.346, n = 309), stages III–IV (7.637, n = 206), T1–T2 (7.422, n = 342), and T3–T4 (7.602, n = 191). In H, PUMA mRNA expression in patient normal tissues is compared to different grading (G grade) using a violin plot. The average expression in tumors ranges from 7.449 to 7.672, showing a fold increase of 1.29 to 1.33 compared to normal tissues (G in tumors: n = 14, 228, 207, 81). I The mRNA expression of PUMA in a set of tissue samples, comprising both adjacent normal tissues and tumor tissues, n = 25. J Immunohistochemical staining of PUMA in paired tumor and adjacent non-cancerous tissues, n = 6. The scale bar is 50 μm. K Western blot presents PUMA protein expression in ccRCC tumor tissues (T) and their corresponding adjacent normal tissues (N). Subsequent quantitative analysis of PUMA protein expression is depicted in the histogram (L). The sample size is 22. M Western blot depicting the protein expression of PUMA in various human ccRCC lines (A-498, ACHN, Caki-1, 786-O, OS-RC-2) with the HK-2 as the control group. Statistical analysis on PUMA protein and mRNA expression in the histogram (N). The mean ± SEM from three or more repeated experiments is presented (*p < 0.05, **p < 0.01, ***p < 0.001, ns = not significant). The denoting system is applied to the tables and figures throughout this study.
Fig. 2
Fig. 2. PUMA’s novel oncogenic role in ccRCC independent of apoptosis.
A Comparison of cell proliferation curves between the shPUMA group and control group (CN) group in A-498 and Caki-1 cells. Cell viability, measured by optical density (OD) values, provides an estimate of the number of living cells, as metabolic activity is proportional to cell number. B Graphical representation of colony formation experiments for both the shPUMA and CN groups, accompanied by statistical analysis (C) (n = 3). D Microscopic images show reduced cell migration and invasion in A-498 and Caki-1 cell lines, as shown in the shPUMA group compared to the CN group. Scale: 20 μm. Statistical analysis is presented in accompanying bar graphs (E) (n = 9). F ORO staining results show lipid droplets in the CN group and the shPUMA group. Scale bar is 20 μm. G Bar graphs present statistical analysis, comparing cellular lipid droplet content between the shPUMA and CN groups. The comparison of triglycerides content and total cholesterol content is shown in (H) (n = 9). I Tumor size was measured at regular three-day intervals (K), extending until the 26th day. Subcutaneous tumor tissues were collected for image documentation and weight measurement (J) (n = 7). A t-test was performed, and error bars indicated the mean ± SEM. L H&E and ORO staining of subcutaneous tumor tissues in both the shPUMA and CN groups, with the images having a scale of 50 μm. M The shPUMA and CN groups in A-498 cells were intravenously injected into nude mice, as an establishment of a metastasis model. After 40 days, differences in invasive capabilities were evaluated by examining the number of liver tissue metastatic foci in both groups of mice and through H&E staining (scale: 50 μm).
Fig. 3
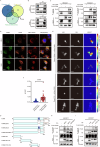
Fig. 3. Direct interaction: FASN as key to PUMA’s function.
A Intersection analysis using Venn diagrams was conducted on the cytoplasmic protein and fatty acid biosynthesis data sets immunopurified with PUMA antibodies. The fatty acid biosynthesis data set is sourced from the laboratory’s self-built storage library. B IP results demonstrate the interaction between endogenous PUMA and FASN in ccRCC cell lines (A-498, Caki-1) (n = 6). C Co-transfection of HA-tagged PUMA and FLAG-tagged FASN plasmids into HEK293T cell. IP using HA and FLAG antibodies facilitated the purification of HA-PUMA and FLAG-FASN, respectively. The interaction between PUMA and FASN was subsequently confirmed using both the FLAG antibody and HA antibody in western blot analysis (n = 6). D Confocal images of PUMA and FASN staining in HK-2, A-498, and Caki-1 cells, utilizing PUMA antibody (green), FASN antibody (orange), mitochondrial dye (Mito-Tracker Red) and DAPI (blue). Merged images illustrate the overlay of the four fluorescent channels. Scale: 5 μm. E HEK293T cells were co-transfected with Clover2-PUMA, and mRuby-FASN. After full crosstalk correction, fluorescence intensities for IDD (donor emission with donor excitation), IDA (acceptor emission with donor excitation), and normalized FRET (NFRET) were calculated and shown. Scale: 5 μm. Statistical histogram derived from NFRET data (n = 12, ***p < 0.001) demonstrated the direct interaction between PUMA and FASN, with the co-transfection of Clover2-N1 and mRuby-FASN serving as the control group (F). G Structure diagrams of plasmid constructs for various PUMA variants, including full-length, domain-deleted (PUMA ΔBH3, PUMA ΔMLS, PUMA ΔBH3/ΔMLS), and fragment-based variants (PUMA N43, PUMA N44-102, PUMA N103-140). H, I Co-transfection of HEK293T cells with HA-tagged plasmids of various PUMA variants (as shown in G) and FLAG-tagged FASN plasmid was performed. After incubation with the HA antibody, Western blot analysis confirmed the interaction by detecting FLAG-FASN using the FLAG antibody (n = 6). Immunopurification results demonstrated the specific interactions between different variants of the PUMA plasmid and the FASN plasmid.
Fig. 4
Fig. 4. PUMA mediates FASN expression to drive ccRCC progression and promote lipid accumulation.
Four distinct subgroups were established by transfecting vector plasmids (Vector) and FASN overexpression plasmids (FASN) in both the shPUMA group and the CN group. A Microscopic images from the transwell experiments depicting migration and invasion results in A-498 and Caki-1 cell lines for all four subgroups. Scale: 20 μm. B The statistical chart presents the outcomes of the transwell experiments shown in images (A) (n = 9). C The proliferation curve plot illustrates the cell viability in A-498 and Caki-1 cells for the four experimental groups, comparing the cell growth status across each group (n = 3). D ORO staining results for the four cell groups, captured at ×400 magnification in A-498 and Caki-1 cells. Scale: 20 μm. E and F The statistical data for lipid droplet content (n = 4), triglyceride, and total cholesterol content measurements in the four cell groups were depicted in histograms (n = 9).
Fig. 5
Fig. 5. PUMA enhances FASN stability and expression via ubiquitin-proteasome pathway.
A Immunohistochemistry microscopic images depict clinical tissue samples categorized into grades I–II and III–IV based on the degree of malignancy. N denotes normal tissue, and T denotes ccRCC tumor tissue. Staining antibodies used were PUMA and FASN, respectively. n = 10. Scale bar: 50 μm. B Protein expression of PUMA and FASN were assessed by western blot in 5 paired tissue specimens derived from ccRCC patients’ pathological tissues. T stood for ccRCC pathological tissues, while N referred to nearby healthy tissues. C A correlation analysis was performed on the protein expression of FASN and PUMA in primary tumor samples. Results: R = 0.6334, R2 = 0.4012, P = 0.027, n = 12. D Immunohistochemical analysis results of the expression of FASN, within subcutaneous tumor tissues from transplanted shPUMA and control ccRCC cell lines in nude mice. Scale: 20 μm. E The protein expression results of PUMA and FASN were assessed by Western blot across various renal cell lines, with β-actin serving as the cellular reference standard. F Western blot analysis on FASN protein expression in the shPUMA group, CN group, and wild type (WT) group. Separate analyses were conducted in the A-498 and Caki-1 cell lines. Additionally, statistical analyses (G) were performed for FASN protein (n = 6) and mRNA expression (n = 4). H, I FASN protein expression was assessed and quantitatively analyzed in both shPUMA and CN groups after treatment with CHX at different time points (n = 3). J FASN protein expression in Caki-1 cells was evaluated through western blot after exposure to MG132 (10 μM) at various time intervals (n = 3). K IP was performed in Caki-1 and A-498 cells with FASN antibodies to purify proteins from both the CN and shPUMA groups. To assess the ubiquitination levels of endogenous FASN, western blot analysis with a ubiquitin antibody was employed subsequently (n = 3). L In HEK293T cells, FLAG-tagged FASN plasmid, and HA-tagged UB plasmids were co-transfected, and after 48 h, FASN ubiquitination levels were examined in a western blot using HA antibodies following incubation with FLAG antibody (n = 3).
Fig. 6
Fig. 6. The PUMA–USP15–FASN axis and its synergistic effects with FASN inhibitors.
A A Venn diagram illustrates the overlap between MS results and the deubiquitinase (DUB) data set. DUB data comes from the UbiBrowser 2.0 online database [60]. B HA-tagged deubiquitinates plasmid and FLAG-tagged PUMA or FASN plasmid were jointly transfected into HEK293T cells. After a 48-h incubation, FLAG-tagged proteins were purified via FLAG antibody IP, and western blot analysis was employed to examine the association of PUMA or FASN with deubiquitinates. C In HEK293T cells, HA-tagged USP15 plasmids and FLAG-tagged FASN plasmids were co-transfected into the CN group, shPUMA group, and PUMA group. USP15-HA protein was immunopurified using the HA tag antibody, and the extent of its interaction with FASN was determined through western blot analysis (n = 3). D IP was performed using USP15 antibody on the shPUMA and CN groups in Caki-1 and A-498 cells, and the interaction strength between endogenous USP15 and FASN was subsequently assessed through western blot analysis (n = 3). E USP15-HA and FASN-FLAG were overexpressed simultaneously in HEK293T cells with a 48-h incubation. USP15-HA protein was immunopurified using HA antibodies, and western blot analysis was then performed to examine its interaction with FASN (n = 3). F Simultaneous co-transfection of FASN-FLAG and UB was performed in HEK293T cells overexpressing USP15 and control cells. The subsequent purification of FASN-FLAG protein using FLAG antibody was followed by western blot analysis to assess its ubiquitination levels. G FASN protein expression in A-498 and Caki-1 cells was evaluated through western blot after exposure to USP15-IN-1 (3.76 μM) and overexpression of PUMA. H Both the shPUMA and CN group cells were treated with C75, a FASN inhibitor (35 μM). The cell viability in A-498 and Caki-1 cells was depicted in the proliferation curve plot, showcasing the differences among the groups (n = 3). I The three-dimensional surface plot (HAS model) visualizes the dose–response relationship of Caki-1 cells to different concentrations of CLZ-8 and C75 treatments. J The final set of images capturing subcutaneous tumor tissue in each group (n = 5) was documented, alongside the observation of tumor size every 4 days (K).
Fig. 7
Fig. 7. Mechanistic model of the PUMA-USP15-FASN axis in ccRCC.
A Mechanism diagram: elevated PUMA expression in ccRCC leads to decreased FASN ubiquitination levels mediated by USP15, resulting in the stabilization of FASN protein expression. The molecular mechanism relationship axis of PUMA–USP15–FASN is delineated. Consequently, this induces increased lipid accumulation and facilitates advanced tumor progression, including proliferation, migration, and invasion.

Similar articles

References

    1. Bajalia EM, Azzouz FB, Chism DA, Giansiracusa DM, Wong CG, Plaskett KN, et al. Phytochemicals for the prevention and treatment of renal cell carcinoma: preclinical and clinical evidence and molecular mechanisms. Cancers. 2022;14:3278. - PMC - PubMed
    1. Siegel RL, Giaquinto AN, Jemal A. Cancer statistics, 2024. CA-Cancer J Clin. 2024;74:12–49. - PubMed
    1. Choueiri TK, Kaelin WG. Targeting the HIF2–VEGF axis in renal cell carcinoma. Nat Med. 2020;26:1519–30. - PubMed
    1. The Cancer Genome Atlas Research Network. Comprehensive molecular characterization of clear cell renal cell carcinoma. Nature. 2013;499:43–49. - PMC - PubMed
    1. Toledo RA, Jimenez C, Armaiz-Pena G, Arenillas C, Capdevila J, Dahia PLM. Hypoxia-inducible factor 2 alpha (HIF2α) inhibitors: targeting genetically driven tumor hypoxia. Endocr Rev. 2022;44:312–22. - PMC - PubMed

MeSH terms