. 2025 Jun 18;16(1):5342.
doi: 10.1038/s41467-025-60471-4.

Reversible proliferative arrest induced by rapid depletion of RNase MRP

Affiliations

Reversible proliferative arrest induced by rapid depletion of RNase MRP

Yuan Liu et al. Nat Commun. .

Abstract

Cellular quiescence is a state of reversible proliferative arrest that plays essential roles in development, resistance to stress, aging, and longevity of organisms. Here we report that rapid depletion of RNase MRP, a deeply conserved RNA-based enzyme required for rRNA biosynthesis, induces a long-term yet reversible proliferative arrest in human cells. Severely compromised biogenesis of rRNAs along with acute transcriptional reprogramming precede a gradual decline of the critical cellular functions. Unexpectedly, many arresting cells show increased levels of histone mRNAs, which accumulate locally in the cytoplasm, and S-phase DNA amount. The ensuing proliferative arrest is entered from multiple stages of the cell cycle and can last for several weeks with uncompromised cell viability. Strikingly, restoring expression of RNase MRP leads to a complete reversal of the arrested state with resumed cell proliferation at the speed of control cells. We suggest that targeting rRNA biogenesis may provide a general strategy for rapid induction of a reversible proliferative arrest, with implications for understanding and manipulating cellular quiescence.


Conflict of interest statement

Competing interests: J.M., W.F.M., and S.C. are inventors on a patent application filed by The Regents of the University of California (U.S. Provisional Patent Application No. 63/581,832) describing the methods of inducing reversible proliferative arrest presented in the manuscript. J.M. and S.C. are the founders of StopTime Inc., a startup focused on identifying and developing methods and compounds for the induction of cell dormancy and hypometabolism. All authors declare no other competing interests.

Figures
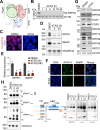
Fig. 1
Fig. 1. Inducible depletion of RNase P and RNase MRP in human cells.
A Schematic of the human RNase P ribonucleoprotein based on the cryo-EM structure from Wu et al.. Protein subunits RPP25, RPP20, POP1, POP5, RPP30, RPP14, RPP40, RPP29, RPP21, RPP38 are colored according to their position in the finger, palm, or wrist modules. The catalytic RNA RPPH1 is in gray. Asterisk indicates the only known protein subunit that is not shared with RNase MRP, RPP21. Arrows indicate subunits targeted in this study. Created in BioRender. Murn, J. (2025) https://BioRender.com/qi2wxxp. B Immunoblot analysis of endogenous HA-tagged RPP40 in C40 cells treated with DMSO or dTAG for the indicated times. Actin serves as a loading control (n = 5). C Immunofluorescence of HA-tagged RPP40 in C40 cells treated with DMSO or dTAG for 3 h. Nuclei are stained with DAPI. Scale bar, 20 μm. D Northern analysis of RPPH1 and RMRP from C40 cells treated with DMSO or dTAG for 3 h or 24 h (n = 3). SNORD3A serves as a loading control. A representative blot is shown. E Quantification by qPCR of RNA samples as in (D) (n = 3 biological replicates). Data represent mean ± SD. *, p < 0.01 (two-tailed Student’s t test). Exact p-values are listed in the Source Data file. F RNA FISH of RPPH1 and RMRP in C40 cells treated with DMSO or dTAG for 3 h. Scale bar, 20 μm. G Immunoblot analysis of RNase P and MRP protein subunits in lysates of C40 cells treated with DMSO or dTAG for 24 h (n = 3). H Northern blot of tRNA processing from samples in panel (D) using probes for the indicated tRNA genes. Primary tRNAArgUCU contains an intron removed separately from 5’ and 3’ sequences. m, mature tRNA; p, precursor tRNA. I Northern blot of rRNA precursors from samples in panel (D). Left, schematic showing positions of probes (5′ ETS, mid, 3′ end) and canonical (blue) and noncanonical (orange) pre-rRNA species,,. RNase MRP cleavage site in ITS1 is indicated. Source data are provided as a Source Data file.
Fig. 2
Fig. 2. Rapid depletion of RNase MRP induces a long-term reversible proliferative arrest.
A Growth of C40 cells treated continuously with DMSO (black) or dTAG for 3 (brown), 7 (red), or 14 days (pink), followed by dTAG washout (WO). Arrows mark the day of WO. The dashed green line shows viability during the 14-day dTAG treatment. Data are mean ± SD (n = 3 biological replicates). B Representative brightfield images of C40 cells on indicated days of DMSO or dTAG treatment. Scale bar, 35 μm. C Correlation between the timing of dTAG WO and time to first significant increase in cell number (blue) or 10-fold increase (red). Mean values from n = 3 experiments are shown. D Time-course immunoblot analysis of RNase P and MRP protein subunits in C40 cells treated with dTAG for 3 days before dTAG washout (n = 3). E qPCR of RPPH1 and RMRP from RNA isolated as in (D) (n = 3 biological replicates). Mean ± SD. *p < 0.05; **p < 0.01 (two-tailed Student’s t test); exact p-values in Source Data file. F Immunoblot analysis of RNase P and MRP protein subunits, including the endogenously tagged RPP40 (HA-RPP40) and ectopic RPP40 (Flag-RPP40), in lysates of Dox-inducible C40 cells treated with DMSO or dTAG with or without Dox, as indicated (n = 3). G Growth of Dox-inducible C40 cells treated with DMSO (black) or dTAG, with Dox added from day 7 onward (orange). Arrow marks Dox addition. Dashed line shows cell viability. Mean ± SD (n = 3 biological replicates). H Flow cytometry of dTAG- or DMSO-treated cells after 1 h EdU pulse. EdU detected with Alexa Fluor 594; DNA stained with FxCycle Violet. In each dot plot, matching DMSO-treated control cells are shown in gray. I Relative mean fluorescence intensity (MFI) in mid-S phase cells over time. J Cell cycle phase distribution based on gating in (H) (dashed gray lines in day 7 plot). “Active” indicates cells synthesizing DNA, and “static” cells not synthesizing DNA. Source data are provided as a Source Data file.
Fig. 3
Fig. 3. Decrease of critical cellular functions.
A, B Decline in global translation. A Puromycin incorporation assay. C40 cells treated with dTAG, as indicated, were incubated with puromycin for 30 min. Cycloheximide (CHX) treatment was performed 10 min prior to puromycin and served as a negative control. Puromycilated proteins in cell lysates were detected by immunoblotting using an anti-puromycin antibody (n = 3). B Puromycin-incorporated protein levels in (A) were quantified and normalized by ACTIN levels. Data are shown as mean ± SD. *, p < 0.01; **, p < 0.0005 (two-tailed Student’s t test); ns, not significant (n = 3 biological replicates). The exact p-values are listed in the Source Data file. CE Reduced metabolic activity. C Reduced ATP production rate by dTAG-treated C40 cells. Control or dTAG-treated cells, as indicated, were analyzed by the ATP rate assay using a Seahorse analyzer (Agilent). ATP production rates through glycolysis or oxidative phosphorylation (OXPHOS) were determined as detailed in Methods. Data are shown as mean ± SD (n = 6 biological replicates). D Decreased mitochondrial activity of dTAG-treated C40 cells, assessed by MitoTracker staining (n = 2). unst, unstained. E Decreased mitochondrial DNA (mtDNA) content of dTAG-treated C40 cells relative to controls. Measured by qPCR and normalized to genomic DNA. Data are shown as mean ± SD. *, p = 0.0178; **, p < 0.01 (two-tailed Student’s t test) (n = 3 biological replicates). The exact p-values are listed in the Source Data file. F Reduced overall transcriptional activity. The rate of RNA synthesis in dTAG-treated C40 cells was measured by pulse-labeling with 5-ethynyluridine (EU) followed by flow cytometry. Actinomycin D (ActD)-treated cells served as a transcriptionally repressed control (n = 3). G Comparison of changes in key cellular functions during the transition of C40 cells from proliferation to dormancy. Time courses of average signals normalized to 100% for DMSO-treated cells from assays in (A, C, D, and F) are shown. Source data are provided as a Source Data file.
Fig. 4
Fig. 4. Early transcriptional response to depletion of RNases P and MRP.
A Impact of dTAG on steady-state mRNA levels. Volcano plots showing differential mRNA abundances between C40 cells treated with DMSO or dTAG for 3 h (RNA-seq data; n = 3). Gray dots indicate all evaluated genes, and colored dots genes belonging to the indicated functional categories (see also Supplementary Fig. 4B and Supplementary Data 1). Colored numbers above the volcano plots are counts of significantly regulated color-highlighted genes (adjusted p-value (padj) < 0.01) in different bins separated by dashed vertical lines according to the strength and sense of regulation. Insets summarize the total numbers of significantly up- or downregulated color-highlighted genes. FC, fold change. See also Supplementary Fig. 4 for changes at 24 h of depletion. B As in (A), showing the impact of dTAG treatment for 3 h on nascent transcripts (TTchem-seq data; n = 3). C Correlation of RNA-seq and TTchem-seq data at 3 h (left) and 24 h (right) of treatment. Red dots indicate significantly regulated histone genes (padj < 0.01). Differentially expressed genes in (A, B) were identified using the DESeq2 package. P-values were adjusted for multiple testing using the Benjamini-Hochberg method to control the false discovery rate.
Fig. 5
Fig. 5. Accumulation of histone mRNAs in cells lacking RNases P and MRP.
A qPCR analysis of indicated histone mRNAs in control or dTAG-treated C40 cells (n = 3 biological replicates). Mean ± SD. *, p < 0.05; **, p < 0.01 (two-tailed Student’s t test). Exact p-values in the Source Data file. B qPCR of histone mRNAs in Dox-inducible C40 cells treated with DMSO or dTAG, with or without Dox (n = 3 biological replicates). Mean ± SD. *, p < 0.05; **, p < 0.01 (two-tailed Student’s t test). Exact p-values in the Source Data file. See also Fig. 2F, G and Supplementary Fig. 2D. C Representative images of control and dTAG-treated C40 cells stained for DNA (blue) and histone H3 and H4 mRNAs (red). Arrows point to cytoplasmic accumulations of histone mRNAs. Scale bar, 20 μm. D Northern analysis of histone mRNAs in C40 cells treated with DMSO or dTAG for 24 h. SNORD3A serves as a loading control (n = 3). The H2A probes recognize multiple histone genes in the H2A cluster. E Schematic of a histone mRNP with conserved 3′ stemloop bound by SLBP and ERI1 (top). ERI1 trims 1–2 nucleotides, which are restored by uridylation (green and orange U’s), producing three distinct 3′ ends (bottom). Created in BioRender. Murn, J. (2025) https://BioRender.com/1dxr6z2. F EnD-seq of H2AC13 mRNA from C40 cells after dTAG treatment. x-axis: last templated nucleotide; y-axis: normalized read counts at each position (CPM, counts per million). Colors indicate nontemplated tail lengths. The sequence below each plot indicates processed histone H2AC13 mRNA 3′ end formed in the nucleus; two nucleotides are subsequently trimmed to yield cytoplasmic histone mRNA (n = 3). G Heatmap summarizing EnD-seq data. Fold changes in nontemplated 3′ terminal nucleotide content for dTAG-treated (3 h and 24 h) versus DMSO-treated control (0 h) conditions are shown for each analyzed histone mRNA. Nontemplated nucleotides were > 99% uridines. Source data are provided as a Source Data file.
Fig. 6
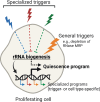
Fig. 6. Model for induction of a reversible proliferative arrest via depletion of RNase MRP.
In primary cells, specialized triggers induce quiescence, in part, by attenuating rRNA (and thus ribosome) biogenesis indirectly, via signaling. In contrast, general triggers, such as rapid depletion of RNase MRP, induce a reversible proliferative arrest by directly blocking rRNA biogenesis, bypassing signaling. A ‘quiescence program’ is likely induced with involvement of changes in gene expression. Both specialized and general triggers of reversible non-proliferation also induce trigger-specific programs of gene expression that do not necessarily contribute to the induction of the arrested state. Created in BioRender. Murn, J. (2025) https://BioRender.com/nbroyt0.

Similar articles

Cited by

References

    1. Zhu, J. & Thompson, C. B. Metabolic regulation of cell growth and proliferation. Nat. Rev. Mol. Cell Biol.20, 436–450 (2019). - PMC - PubMed
    1. Dworkin, J. & Harwood, C. S. Metabolic reprogramming and longevity in quiescence. Annu. Rev. Microbiol.76, 91–111 (2022). - PubMed
    1. O’Farrell, P. H. Quiescence: early evolutionary origins and universality do not imply uniformity. Philos. Trans. R. Soc. Lond. B Biol. Sci.366, 3498–3507 (2011). - PMC - PubMed
    1. Marescal, O. & Cheeseman, I. M. Cellular mechanisms and regulation of quiescence. Dev. Cell55, 259–271 (2020). - PMC - PubMed
    1. Mohammad, K., Dakik, P., Medkour, Y., Mitrofanova, D. & Titorenko, V. I. Quiescence entry, maintenance, and exit in adult stem cells. Int. J. Mol. Sci.20, 10.3390/ijms20092158 (2019). - PMC - PubMed

LinkOut - more resources