Measurement of Immunoglobulin Intraclonal diversification refines the clinical impact of IGHV mutational status in chronic lymphocytic leukemia
- PMID: 40533497
- PMCID: PMC12310548
- DOI: 10.1038/s41375-025-02650-2
Measurement of Immunoglobulin Intraclonal diversification refines the clinical impact of IGHV mutational status in chronic lymphocytic leukemia
Abstract
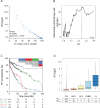
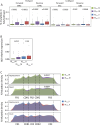
Chronic lymphocytic leukemia (CLL) cells may bear mutations in IGHV genes, the 2%-cutoff allowing to discriminate two subsets, unmutated (U)- or mutated (M)-CLL, with different clinical course. IGHV genes may also incorporate additional ongoing mutations, a phenomenon known as intraclonal diversification (ID). Here, through an original bioinformatic workflow for NGS data, we used the inverse Simpson Index (iSI) as diversity measure among IGHV sequences to dichotomize cases with different ID levels into IDhigh (iSI ≥ 1.2) vs. IDlow (iSI < 1.2) both in CLL (n = 983) and in other lymphoproliferative disorders (LPD; n = 127). In CLL, IDhigh cases accounted for 14.6%, overrepresented in M-CLL (P = 0.0028), while higher percentages were documented in GC-derived LPD. In M-CLL (n = 396), IDhigh patients (n = 69) experienced longer time-to-first treatment than IDlow patients (P = 0.015), and multivariate analyses (n = 299) confirmed ID as independent variable. IGHV gene mutations of IDhigh cases had molecular signatures indicating ongoing activity of the AID)/Polη-dependent machinery; consistently, IDhigh M-CLL expressed higher levels of AID transcripts than IDlow M-CLL (P = 0.012). In conclusion, we propose a robust NGS protocol to quantitatively evaluate ID in CLL, demonstrating that: i) all CLL patients presented ID although at various degree; ii) high degree of ID has clinical relevance identifying a M-CLL subset with better outcome.
© 2025. The Author(s).
Conflict of interest statement
Competing interests: The authors declare no competing interests. Ethics approval and consent to participate: The study was carried out in accordance with the declaration of Helsinki upon IRB approval (Approval n. IRB-05-2010 and n. IRB-05- 2015, Centro di Riferimento Oncologico of Aviano; Approval n. 10C0066, National Cancer Institute; Approval, University of Würzburg, January 17th, 2006), and informed consent.
Figures


Similar articles
-
Methylation-based droplet digital polymerase chain reaction shows high concordance with chronic lymphocytic leukemia IGHV somatic mutation status.Am J Clin Pathol. 2025 Sep 9;164(3):474-483. doi: 10.1093/ajcp/aqaf075. Am J Clin Pathol. 2025. PMID: 40734655
-
Preferential use of unmutated immunoglobulin heavy variable region genes in Boxer dogs with chronic lymphocytic leukemia.PLoS One. 2018 Jan 31;13(1):e0191205. doi: 10.1371/journal.pone.0191205. eCollection 2018. PLoS One. 2018. PMID: 29385200 Free PMC article.
-
ATM aberrations in chronic lymphocytic leukemia: del(11q) rather than ATM mutations is an adverse-prognostic biomarker.Leukemia. 2025 Jul;39(7):1650-1660. doi: 10.1038/s41375-025-02615-5. Epub 2025 Apr 24. Leukemia. 2025. PMID: 40275070 Free PMC article.
-
Why Is the Immunoglobulin Heavy Chain Gene Mutation Status a Prognostic Indicator in Chronic Lymphocytic Leukemia?Acta Haematol. 2018;140(1):51-54. doi: 10.1159/000491382. Epub 2018 Aug 16. Acta Haematol. 2018. PMID: 30114695 Free PMC article. Review.
-
Should IGHV status and FISH testing be performed in all CLL patients at diagnosis? A systematic review and meta-analysis.Blood. 2016 Apr 7;127(14):1752-60. doi: 10.1182/blood-2015-10-620864. Epub 2016 Feb 3. Blood. 2016. PMID: 26841802
References
-
- Eichhorst B, Ghia P, Niemann CU, Kater AP, Gregor M, Hallek M, et al. ESMO Clinical Practice Guideline interim update on new targeted therapies in the first line and at relapse of chronic lymphocytic leukaemia. Ann Oncol. 2024;35:762–8. - PubMed
-
- Hallek M, Al-Sawaf O. Chronic lymphocytic leukemia: 2022 update on diagnostic and therapeutic procedures. Am J Hematol. 2021;96:1679–705. - PubMed
-
- Shadman M. Diagnosis and treatment of chronic lymphocytic leukemia: a review. JAMA. 2023;329:918–32. - PubMed
-
- Lee J, Wang YL. Prognostic and predictive molecular biomarkers in chronic lymphocytic leukemia. J Mol Diagn. 2020;22:1114–25. - PubMed
MeSH terms
Substances
Grants and funding
- IG-21687/Associazione Italiana per la Ricerca sul Cancro (Italian Association for Cancer Research)
- PNRR-MAD-2022-12375673/Ministero della Salute (Ministry of Health, Italy)
- Venezia Section/Associazione Italiana Contro le Leucemie - Linfomi e Mieloma (Associazione Italiana Contro le Leucemie - Linfomi e Mieloma ONLUS)
LinkOut - more resources
Full Text Sources
Miscellaneous

