. 2025 Aug;39(8):1937-1947.
doi: 10.1038/s41375-025-02660-0. Epub 2025 Jun 18.

A molecular signature predicts hematologic evolution in polycythemia vera patients

Collaborators, Affiliations

A molecular signature predicts hematologic evolution in polycythemia vera patients

Olivier Mansier et al. Leukemia. 2025 Aug.

Abstract

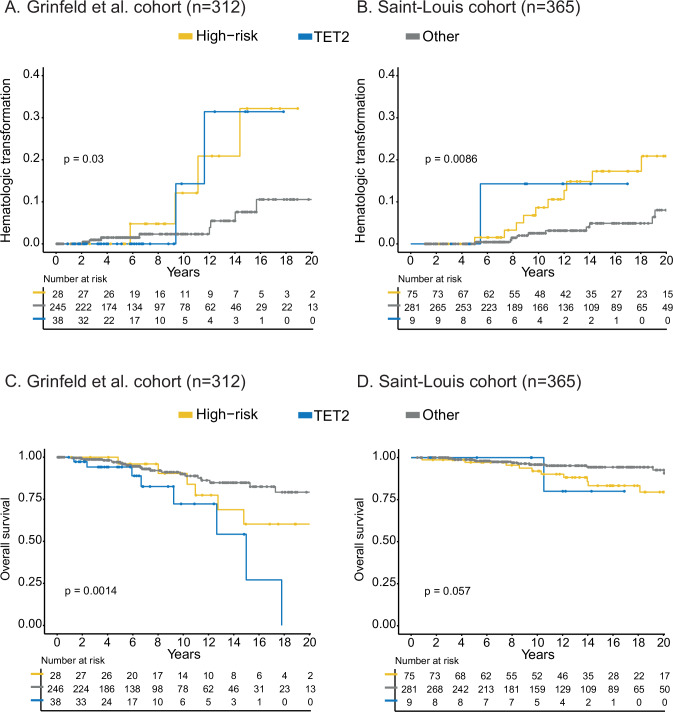
Genetic analyses have been included in scoring systems to improve the prognostic stratification of hematologic malignancies. Until now, molecular risk scores have not been included into the practical management of patients with polycythemia vera (PV). In this work, we studied 439 PV patients recruited from 15 French centers and described their mutational landscape using high-throughput sequencing. We detected an additional mutation in 53.3% of patients, 22.7% of them having 2 or more mutations. A Bayesian approach identified preferential associations between mutations. Based on these associations, we identified high molecular risk abnormalities in PV (PV-HMR), consisting in mutations in SRSF2, IDH1/2, EZH2 or NFE2 genes, copy number variations (CNV) and carrying 2 or more non-driver mutations. These PV-HMR were associated with decreased overall survival (OS) and/or transformation-free survival (TFS). Notably, ASXL1 mutations were not associated with a pejorative impact on OS or TFS when isolated. Based on these results, we developed a genomic 3-tier classification that efficiently predicted OS and more importantly TFS independently of age, sex, history of thrombosis and leukocyte and platelet counts. This model outperformed the IWG-PV and MIPSS-PV scoring systems in predicting the hematologic evolution of PV patients, which was confirmed in 2 external cohorts.


Conflict of interest statement

Competing interests: The authors declare no competing financial interests. Ethics approval and patient consent: This work is also a deliverable of the FIMBANK network, which was founded by the French ‘Institut National du Cancer’ (INCa BCB 2013 & 2020).

Figures

Fig. 1
Fig. 1. Mutational landscape of the whole cohort.
A Distribution of the number of additional mutations (i.e. not JAK2-driver) in the cohort of 439 PV patients. B Total number of mutations per genes according to the type of mutation: truncated for nonsense or frameshift and SNV for others. C The distribution of allele burden of additional mutations was represented by violin plots. D Correlation plot showing the positive and negative association between mutations and clinical or biological presentation at the time of diagnosis. Only associations with a p-value < 0.05 are reported.
Fig. 2
Fig. 2. Mutational network derived from associations of mutations.
A Bayesian network representing association between genes mutated, based on the allele frequencies and co-occurrence of mutations. Genes mutated in at least 7 patients were kept in the analysis. Green links represent a positive association. B Pairwise associations between mutated genes were represented by a correlation plot based on the allele burden of mutations (left panel) and a circos plot based on the presence of mutations (right panel). For the circos plot, truncating and SNV mutations were grouped for TET2 and DNMT3A genes.
Fig. 3
Fig. 3. Prognostic impact of additional mutations.
A Forest plots summarizing the individual impact of each genomic category for overall survival (left panel) and hematologic transformation (right panel). High risk mutations include SRSF2, EZH2, IDH1, IDH2, CBL and NFE2 mutations. CNV include abnormalities of chromosomes 1q, 5, 7, 8, 13 and 20. Significant associations are represented in blue. B Kaplan-Meier curves showing the impact of allele burden on overall survival for TET2 (left panel) and DNMT3A (right panel) mutations.
Fig. 4
Fig. 4. A genomic classification for predicting survival and transformation.
A Sequential definition of the three genomic groups. B Kaplan-Meier curves showing the impact of the genomic groups on overall survival (left panel) and hematologic transformation (right panel). C Results of the multistate model considering the transitions between chronic phase, hematologic transformations and death. The following variables at diagnosis were included: genomic groups, age, gender, history of thrombosis, leukocytes and platelets counts, neutrophil/lymphocyte ratio and constitutional symptoms. A stepwise downward selection was performed. PV polycythemia vera.
Fig. 5
Fig. 5. Validation of the molecular signature impact in two external cohorts.
Kaplan-Meier curves showing hematologic transformation in A Grinfeld et al. cohort and B Saint-Louis Hospital cohort, and overall survival in C Grinfeld et al. cohort and D Saint-Louis Hospital cohort.

Similar articles

References

    1. Vainchenker W, Kralovics R. Genetic basis and molecular pathophysiology of classical myeloproliferative neoplasms. Blood. 2017;129:667–79. - PubMed
    1. Luque Paz D, Kralovics R, Skoda RC. Genetic basis and molecular profiling in myeloproliferative neoplasms. Blood. 2023;141:1909–21. - PMC - PubMed
    1. Hultcrantz M, Wilkes SR, Kristinsson SY, Andersson TM-L, Derolf ÅR, Eloranta S, et al. Risk and cause of death in patients diagnosed with myeloproliferative neoplasms in Sweden between 1973 and 2005: a population-based study. J Clin Oncol. 2015;33:2288–95. - PubMed
    1. Barbui T, Barosi G, Birgegard G, Cervantes F, Finazzi G, Griesshammer M, et al. Philadelphia-negative classical myeloproliferative neoplasms: critical concepts and management recommendations from European LeukemiaNet. J Clin Oncol. 2011;29:761–70. - PMC - PubMed
    1. Liu D, Li B, Xu Z, Zhang P, Qin T, Qu S, et al. RBC distribution width predicts thrombosis risk in polycythemia vera. Leukemia. 2022;36:566–8. - PMC - PubMed

Substances

LinkOut - more resources