. 2025 Jul;57(7):1620-1627.
doi: 10.1038/s41588-025-02229-8. Epub 2025 Jun 18.

Incorporating genetic data improves target trial emulations and informs the use of polygenic scores in randomized controlled trial design

Collaborators, Affiliations

Incorporating genetic data improves target trial emulations and informs the use of polygenic scores in randomized controlled trial design

Jakob German et al. Nat Genet. 2025 Jul.

Erratum in

Abstract

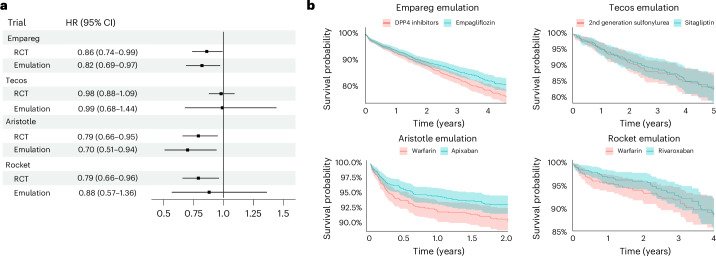
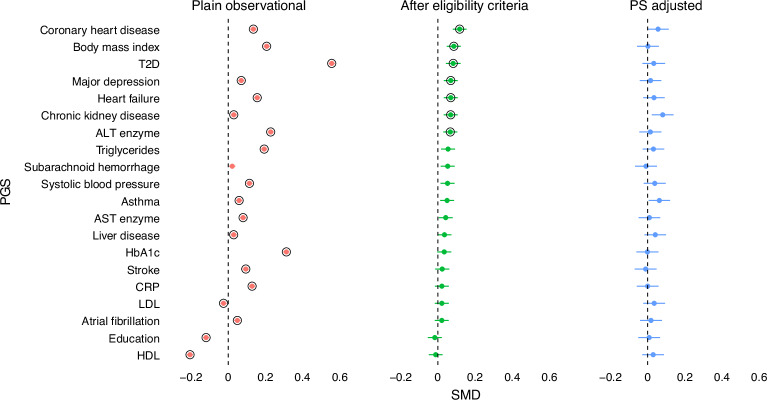
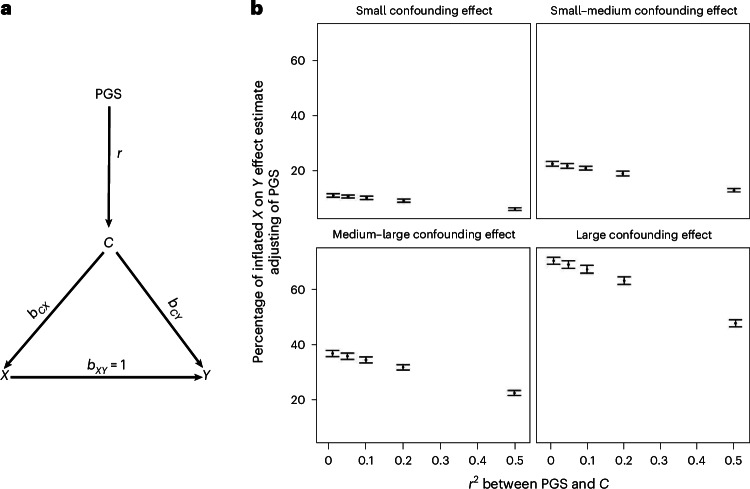
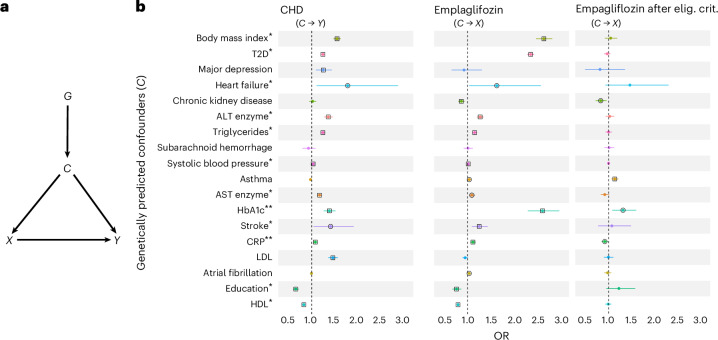
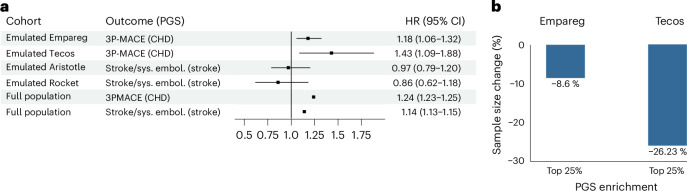
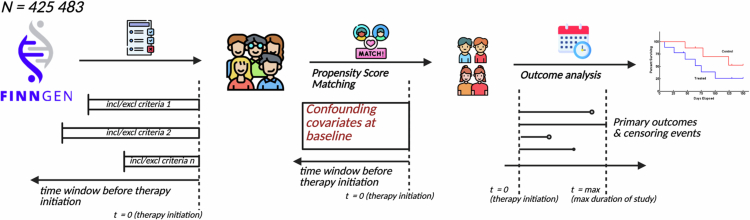
Randomized controlled trials (RCTs) remain the gold standard for evaluating medical interventions, yet ethical, practical and financial constraints often necessitate reliance on observational data and trial emulations. This study explores how integrating genetic data can enhance both emulated and traditional trial designs. Using FinnGen (n = 425,483), we emulated four major cardiometabolic RCTs and showed how reduced differences in polygenic scores (PGS) between trial arms track improvement in study design. Simulation studies reveal that PGS alone cannot fully adjust for unmeasured confounding. Instead, Mendelian randomization analyses can be used to detect likely confounders. Finally, trial emulations provide a platform to assess and refine PGS implementation for genetic enrichment strategies. By comparing associations of PGS with trial outcomes in the general population and emulated trial cohorts, we highlight the need to validate prognostic enrichment approaches in trial-relevant populations. These results highlight the growing potential of incorporating genetic information to optimize clinical trial design.


Conflict of interest statement

Competing interests: A.G. is the founder of Real World Genetics OY. P.N. reports research grants from Allelica, Amgen, Apple, Boston Scientific, Genentech/Roche and Novartis; personal fees from Allelica, Apple, AstraZeneca, Blackstone Life Sciences, Creative Education Concepts, CRISPR Therapeutics, Eli Lilly & Co, Foresite Labs, Genentech/Roche, GV, HeartFlow, Magnet Biomedicine, Merck and Novartis; scientific advisory board membership of Esperion Therapeutics, Preciseli, TenSixteen Bio and Tourmaline Bio; scientific cofounder of TenSixteen Bio; equity in MyOme, Preciseli and TenSixteen Bio; and spousal employment at Vertex Pharmaceuticals (unrelated to the present work). A.P. is an employee of Alphabet and has previously received research support from Microsoft, Alphabet, Intel, IBM and Bayer. E.P. was supported by research grants from the National Institute of Diabetes and Digestive and Kidney Diseases (R01DK138036), the Patient Centered Outcomes Research Institute (DB-2020C2-20326) and the Food and Drug Administration (5U01FD007213), not related to the topic of this work. She is the principal investigator of a research grant to the Brigham and Women’s Hospital from Boehringer Ingelheim, not related to the topic of this work. She receives royalties from UpToDate. The other authors declare no competing interests.

Figures

Fig. 1
Fig. 1. Agreement between RCTs and their RWD emulations in FinnGen.
a, Comparison of the estimates (HR and 95% CI) of the RCT and their emulation in FinnGen. Points represent estimated HRs; horizontal lines denote 95% CI. The vertical continuous line indicates the null value (HR = 1). Empareg, BI 10773 (Empagliflozin) cardiovascular outcome event trial in patients with T2D mellitus (nRCT = 7,020, nEmulation = 4,522); Tecos, sitagliptin cardiovascular outcomes study (MK-0431-082; nRCT = 14,514, nEmulation = 1,094); Aristotle, apixaban for the prevention of stroke in patients with AF (nRCT = 18,240, nEmulation = 2,292); Rocket, an efficacy and safety study of rivaroxaban with warfarin for the prevention of stroke and noncentral nervous system systemic embolism in patients with nonvalvular AF (nRCT = 13,916, nEmulation = 1,030). b, Kaplan–Meier plots for primary endpoints in FinnGen trial emulations. Lines represent the estimated survival (or event-free) probability over time. Shaded areas indicate 95% CI. Source data
Fig. 2
Fig. 2. SMD of 20 PGS across different stages of the Empareg trial emulation.
Plain observational—empagliflozin initiators versus noninitiators (n = 425,483). After eligibility criteria—Empareg trial emulation cohort after applying inclusion/exclusion criteria and including an active-comparator group (DPP4 inhibitor user). The comparison is between empagliflozin initiators versus DDP4 initiators (n = 11,349). PS adjusted—Empareg trial emulation cohorts after inclusion/exclusion criteria and a 1:1 PS nearest-neighbor matching for 28 covariates. The comparison is between empagliflozin initiators versus DDP4 initiators (n = 4,522). The SDMs of the two trial arms are plotted as point estimates and lines representing their 95% CI. A circle around the point estimates represents statistical significance after a Bonferroni-corrected P value threshold (2.5 × 10−3). Statistical tests for comparing the means between groups were conducted using two-sided t tests, with appropriate adjustments for multiple comparisons via Bonferroni correction. Analogous plots for the other trial emulations can be found in the Supplementary Figs. 1–3. ALT, alanine transaminase; AST, aspartate transaminase; LDL, low-density lipoprotein; HDL, high-density lipoprotein. Source data
Fig. 3
Fig. 3. Evaluating the utility of PGS for confounder adjustment.
a, A DAG illustrates the causal structure between PGS, confounder (C), treatment (X) and outcome (Y). The PGS serves as an imperfect proxy variable for the confounder. The effects of the C on the exposure (X) and outcome (Y) are denoted as bCX and bCY, respectively. The true unconfounded effect of X on Y is bXY = 1. b, Simulation study—under this model (Methods), we changed the correlation between C and PGS simply by varying r and the effect of confounding factor C on X and Y by varying bCX and bCY. Under each condition, we measured the observed effect of X on Y, conditioned on PGS and calculated the bias as a percentage of the inflated effect of X on Y. bCX2Var(X) = bCY2Var(Y) = 0.1 for small confounding effect, 0.2 for small-medium confounding effect, 0.3 for medium-large confounding effect and 0.5 for large confounding effect. Under each condition, we carried out experiments for 100 iterations (each n = 100,000). Data are presented as mean values and 95% tolerance intervals (±1.96 × s.d.). These simulations show that even if PGS is strongly correlated with the confounder (that is, r2 = 0.5)—an unlikely scenario, given the correlation between PGS and traits is generally lower—correcting for PGS does not completely account for the bias introduced by the confounder. Source data
Fig. 4
Fig. 4. Using MR within the Empareg trial emulation to identify confounders.
a, A DAG illustrating the relationship between treatment initiation (X) and trial outcome (Y), as well as the effect of a genetic instrument (G) of a confounding variable (C) on both the treatment initiation and trial outcome, only through the confounding variable. b, Results of an MR analysis using IVW as a statistical test to study the causal effects of 18 traits on CHD, representing the trial outcome, and empagliflozin, representing the treatment initiation. Left: MR for association between 18 traits on coronary artery disease using two-sample MR. Middle: MR for association between 18 traits on empagliflozin initiation in the full study population. Right: MR for association between 18 traits on empagliflozin initiation after applying the RCT’s eligibility criteria. The point estimates represent the ORs with lines representing their 95% CI. For continuous confounders, the OR reflects the change in the outcome variable associated with a 1 s.d. increase in the exposure variable; for binary confounders, the OR represents the change in the outcome variable when comparing the presence versus the absence of the binary exposure. A circle around the point estimates represents statistical significance with a P value threshold of 5 × 10−2. A square around the point estimate represents statistical significance with a P value threshold of 2.8 × 10−3. Single asterisk represents putative confounder due to significance in left and middle panels of b; double asterisks represent putative confounder due to significance in left and right panels of b. Elig. crit., eligibility criteria. Source data
Fig. 5
Fig. 5. Effect of the PGS on the primary trial outcomes among individuals included in trial emulations and in the full study population.
a, Effect of the outcome PGS on the primary outcome within each 1:1 nearest-neighbor PS-matched trial cohort using Cox regression and adjusting for the treatment, as well as within the full FinnGen population. HRs per one s.d. increase in genetic liability, and their 95% CIs are illustrated in the central forest plot. Points represent estimated HRs; horizontal lines denote 95% CIs. The vertical continuous line indicates the null value (HR = 1). b, Sample size reduction of the emulated Empareg and Tecos trials after enriching the trial cohorts with individuals at the top 25% genetic risk for CHD (top 25% CHD PGS). Sys. embol., systemic embolism. Source data
Extended Data Fig. 1
Extended Data Fig. 1. Trial emulation design.
This flowchart depicts the involved steps in closely replicating original randomized controlled trials (RCTs) in observational data. Using FinnGen as our data source, we defined the treatment strategies, translated and applied the RCT’s eligibility criteria, selected confounding variables and incorporated 1:1 nearest-neighbor propensity score-matching and performed an outcome analysis after specifying primary endpoints and censoring events, finally obtaining hazard ratios and 95% confidence intervals. The steps are further detailed in the Methods. Incl, inclusion; excl, exclusion; t, time.

Similar articles

References

    1. Feinstein Alvan, R. & Horwitz Ralph, I. Double standards, scientific methods, and epidemiologic research. N. Engl. J. Med.307, 1611–1617 (1982). - PubMed
    1. Bakker, E. et al. Contribution of real-world evidence in European Medicines Agency’s regulatory decision making. Clin. Pharmacol. Ther.113, 135–151 (2023). - PMC - PubMed
    1. Real-World Evidence (U.S. Food and Drug Administration, 2024); www.fda.gov/science-research/science-and-research-special-topics/real-wo...
    1. Hernán, M. A. & Robins, J. M. Using big data to emulate a target trial when a randomized trial is not available. Am. J. Epidemiol.183, 758–764 (2016). - PMC - PubMed
    1. Didelez, V., Haug, U. & Garcia-Albeniz, X. Re: are target trial emulations the gold standard for observational studies? Epidemiology35, e3 (2024). - PubMed

MeSH terms

LinkOut - more resources