. 2025 Jul;643(8072):744-754.
doi: 10.1038/s41586-025-09083-y. Epub 2025 Jun 18.

Single-cell transcriptomic and chromatin dynamics of the human brain in PTSD

Collaborators, Affiliations

Single-cell transcriptomic and chromatin dynamics of the human brain in PTSD

Ahyeon Hwang et al. Nature. 2025 Jul.

Abstract

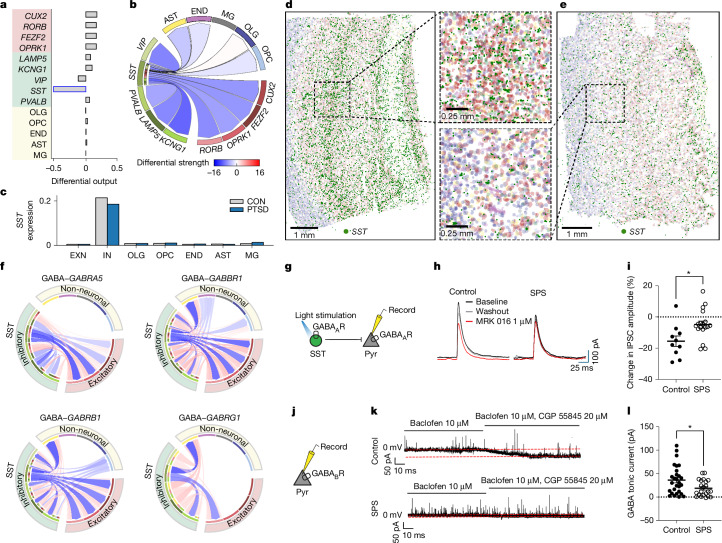
Post-traumatic stress disorder (PTSD) is a polygenic disorder occurring after extreme trauma exposure. Recent studies have begun to detail the molecular biology of PTSD. However, given the array of PTSD-perturbed molecular pathways identified so far1, it is implausible that a single cell type is responsible. Here we profile the molecular responses in over two million nuclei from the dorsolateral prefrontal cortex of 111 human brains, collected post-mortem from individuals with and without PTSD and major depressive disorder. We identify neuronal and non-neuronal cell-type clusters, gene expression changes and transcriptional regulators, and map the epigenomic regulome of PTSD in a cell-type-specific manner. Our analysis revealed PTSD-associated gene alterations in inhibitory neurons, endothelial cells and microglia and uncovered genes and pathways associated with glucocorticoid signalling, GABAergic transmission and neuroinflammation. We further validated these findings using cell-type-specific spatial transcriptomics, confirming disruption of key genes such as SST and FKBP5. By integrating genetic, transcriptomic and epigenetic data, we uncovered the regulatory mechanisms of credible variants that disrupt PTSD genes, including ELFN1, MAD1L1 and KCNIP4, in a cell-type-specific context. Together, these findings provide a comprehensive characterization of the cell-specific molecular regulatory mechanisms that underlie the persisting effects of traumatic stress response on the human prefrontal cortex.


Conflict of interest statement

Competing interests: J.H.K. has consulting agreements (less than US$10,000 per year) with Aptinyx, Biogen, Idec, MA, Bionomics, Boehringer Ingelheim International, Epiodyne, EpiVario, Janssen Research and Development, Jazz Pharmaceuticals, Otsuka America Pharmaceutical, Spring Care, Sunovion Pharmaceuticals; is the co-founder for Freedom Biosciences; serves on the scientific advisory boards of Biohaven Pharmaceuticals, BioXcel Therapeutics (Clinical Advisory Board), Cerevel Therapeutics, Delix Therapeutics, Eisai, EpiVario, Jazz Pharmaceuticals, Neumora Therapeutics, Neurocrine Biosciences, Novartis Pharmaceuticals Corporation, PsychoGenics, Takeda Pharmaceuticals, Tempero Bio, Terran Biosciences; has stock options with Biohaven Pharmaceuticals Medical Sciences, Cartego Therapeutics, Damona Pharmaceuticals, Delix Therapeutics, EpiVario, Neumora Therapeutics, Rest Therapeutics, Tempero Bio, Terran Biosciences, Tetricus; and is an editor of Biological Psychiatry with income greater than US$10,000. The other authors declare no competing interests.

Figures

Fig. 1
Fig. 1. Multimodal genomic taxonomy of cell types in the human PFC and cell-type-specific gene expression changes.
a, Schematic of the analyses. TF, transcription factor. b, Uniform manifold approximation and projection (UMAP) of snRNA-seq (n = 935,371 nuclei) across 14 subtypes (top) and cell proportion of subtypes across diagnostic conditions (CON, MDD and PTSD; bottom). *FDR < 0.05. c, UMAP of snATAC-seq (n = 473,033 nuclei) across seven cell types (top) and proportion of cell types across conditions (bottom). d, UMAP of snMultiome (n = 119,431 nuclei) across 14 subtypes (top) and proportions across conditions (bottom). e, Significant DEG counts in both directions for each major cell type (left), EXN subtypes (right top) and IN subtypes (right bottom) coloured by the number of DEGs. f, Binary plot indicating occurrence of n = 1,184 PTSD snDEGs across cell types. g, log2FC values of the top DEGs for each cell type from MAST (top) and bulk RNA-seq (bottom). h, Overlap between n = 1,184 PTSD snDEGs and n = 1,918 MDD snDEGs. i, Top biological process (BP) and molecular function (MF) Enrichr Gene Ontology terms for the n = 502 PTSD-specific DEGs from panel h. j, Log-normalized mean expression of significantly discordant genes (CTNNA3 (top) and HSPA1A (bottom)) in each subtype for PTSD (blue) and MDD (orange). The asterisk indicates significance from rank–rank hypergeometric overlap (RRHO).
Fig. 2
Fig. 2. Spatial transcriptomic analysis of the PTSD PFC.
a, Sample description and UMAP of snXenium (n = 523,314 nuclei) across seven cell types (top) and proportion of cell types across conditions (bottom). b, Expression of canonical markers for cell-type annotation (diagonal). The circle radius represents the fraction of cells, and the shade represents mean log-normalized expression. c, PTSD snXenium DEG counts in both directions using MAST. d, Overlap between PTSD snRNA-seq and snXenium MAST DEGs (lighter shade denotes snRNA-seq, and darker shade indicates snXenium). e, Volcano plot showing PTSD versus CON MAST DEGs in END from snXenium. Genes labelled and outlined in black overlap with snRNA-seq END MAST results. Horizontal dashed line indicates FDR < 0.01 and vertical dashed line indicates absolute fold change >1.1. f, Mean FKBP5 log-normalized counts comparing n = 10 CON versus n = 4 PTSD samples by cell type. g, CON slide with FKBP5 transcripts indicated in dark purple and each nucleus in its corresponding cell-type colour (END in light purple). The zoomed-in image in the inset shows a local blood vessel with high FKBP5 expression. One experiment was conducted. h, PTSD slide with FKBP5 transcripts indicated in dark purple and each nucleus in its corresponding cell-type colour (END in light purple). One experiment was conducted.
Fig. 3
Fig. 3. CCC alterations in PTSD.
a, Barplot of the log differential output of all sender cell types. The SST IN was downregulated in its output signalling (log differential output = −0.518). b, Circos plot showing differential strength of all cell-to-cell interactions from SST INs between PTSD and CON. The shading indicates their quantitative values, with higher numbers indicating higher differential strengths. c, Mean SST log-normalized counts comparing 10 CON versus 4 PTSD samples by cell types. d, CON slide with SST transcripts indicated in dark green and each nucleus in its corresponding cell-type colour in a lighter shade (IN in light green). The CON inset zooms into layer 5, showing higher expression of SST in IN nuclei. One experiment was conducted. e, PTSD slide with SST transcripts indicated in dark green and each nucleus in its corresponding cell-type colour in a lighter shade (IN in light green). The PTSD inset zooms into layer 5, where SST expression is decreased. One experiment was conducted. f, Circos plots of GABA–GABRA5, GABA–GABBR1, GABA–GABRB1 and GABA–GABRG1 showing a decrease in differential output strength of all cell-to-cell interactions from SST INs in individuals with PTSD. Edges are coloured by interaction strength in PTSD cells (red denotes stronger, and blue indicates weaker). g, Schematic of the slice electrophysiology experimental setup. ChR2 was selectively expressed in SST IN in the mouse mPFC. IPSCs were evoked with 470-nm light pulses and recorded in mPFC layer 5 pyramidal neurons (Pyr). h, Representative eIPSCs (baseline in black, MRX 016 in red, and after washout in grey) recorded in control versus SPS mice i, Quantification of the percentage of IPSC amplitude change in the GABARα5 antagonist MRX 016 compared with baseline. Two-sided Student’s t-test was used, P = 0.01. n = 10 control samples and n = 18 SPS samples. Lines indicate mean, and error bars denote s.e.m. j, Schematic of the experimental setup. k, Representative traces from control (top) and SPS (bottom) held at 0 mV with Baclofen (a GABAB receptor agonist) and washing in CGP 55845 (a GABAB receptor antagonist). CGP 55845 induced a decrease in GABA tonic current in a pyramidal neuron in control but not in SPS. Red dotted lines indicate average baseline holding current before and after CGP 55845 bath application. l, Quantification of the size of GABA tonic current in control versus SPS. Two-sided Welch’s t-test was used, P = 0.02. n = 28 control samples and n = 22 SPS samples. Lines indicate mean, and error bars denote s.e.m. *P < 0.05. Source data
Fig. 4
Fig. 4. PTSD alters cis-regulation of gene expression across cell types.
a, Number of chromatin peaks separated by genomic category (intronic (intron), distal (dist), promoter (prom) and exonic (exon)) for the major cell types in snATAC-seq. b, Upset plot showing the number of peaks (first bar by cell type) and the overlap of peaks across different cell types (subsequent bars). c, Side-by-side heatmaps of linked ATAC (left) and gene (right) regions. Peak-to-gene links (n = 1,433,145) are shown using thresholds: FDR < 1 × 10−4 and correlation > 0.45. d, Donut plot showing the number of CREs (n = 395,932) with significantly linked genes (correlation > 0.4 and FDR < 0.05) separated by genomic category. e, Venn diagrams showing the intersection of CLGs and PTSD DEGs for each cell type. f, UMAP plot of FKBP5 highlighted by snRNA-seq log-normalized gene expression (top) and snATAC-seq gene score (bottom). Non-neuronal cell types with high expression of FKBP5 are outlined by the dashed line. g, Chromatin accessibility signal tracks highlighting FKBP5 peak-to-gene links (correlation > 0.75) across cell types in region chromosome 6 (Chr. 6): 35200000–35900000. The signals for non-neuronal cell types are indicated by the dashed boxes.
Fig. 5
Fig. 5. Cell-type-specific cis-regulation at PTSD disease genetic risk loci.
a, LDSC enrichment of various GWAS traits including PTSD, other psychiatric and non-psychiatric disorders in the snATAC-seq cell types (*FDR < 0.05, **FDR < 0.005 and ***FDR < 0.0005). IBD, irritable bowel disease. b, Lollipop plot showing LDSC enrichment of GWAS traits comparing bCREs (grey) versus snMultiome peaks (coloured). The colour of the dot represents the subtype in snMultiome with the highest enrichment value for the trait. cf, Cis-regulatory architecture at the following GWAS loci and cell types: ELFN1 in IN; and KCNIP4, EGR3 and LRFN5 in EXN. IN and EXN CREs were used to fine-map SNPs for total PCL. For the fine-mapping track, we only plotted SNPs with PIP > 0.0001 for visualization purposes, and only highlight peak-to-gene loops for SNPs with PIP > 0.05, outlined in black if they are within a CRE (lead SNP in red, and MVP SNP in purple). The top two credible SNPs and MVP SNP are labelled. The loops are coloured by cell type (EXN in red and IN in green). Chromosome coordinates are: ELFN1 (chr. 7: 1450000–2350000; c); KCNIP4 (chr. 4: 20600000–22600000; d); EGR3 (chr. 8: 22193302–23193302; e); and LRFN5 (chr. 14: 41105000–4230000; f). NeuN+ TADs are shown above each ideogram, and the coloured triangles correspond to the TAD with significant inter-chromosomal looping in the area.
Extended Data Fig. 1
Extended Data Fig. 1. Table of demographics.
Demographic and clinical summary of CON, MDD, and PTSD cohorts for a, 111 RNA/ATAC samples, b, 25 Multiome samples, and c, 18 Xenium samples.
Extended Data Fig. 2
Extended Data Fig. 2. Cell type canonical markers and transcriptomic cell type annotation.
UMAP of canonical marker genes across major cell types in a, snRNA-seq, b, snATAC-seq, and c, snMultiome. d, Average single nucleus gene expression heatmap of canonical cell type marker genes across 14 subtypes in snRNA-seq. e, Normalized chromatin accessibility profiles of canonical cell type marker genes with TSS marked across seven cell types in snATAC-seq. f, Circos plot of 61 fine annotation transcriptomic subtypes of snRNA-seq. From inner to outer circles: 1) UMAP of snRNA-seq colored by cell types, 2) number of cells in each transcriptomic subtype, 3) dot plot of the subtype marker, 4) labels of seven cell types, 5) labels of 14 subtype markers, 6) labels of 61 fine annotation transcriptomic subtypes. g, Heatmap of average gene expression of subtype markers and broader neuronal (excitatory, inhibitory) and non-neuronal class markers across transcriptomic subtypes.
Extended Data Fig. 3
Extended Data Fig. 3. Gene set enrichment of PTSD DEGs.
a, Cosine similarity heatmap of 14 subtype DEG lists. b, Top BP and MF enrichR GO terms of the 1,184 PTSD snDEGs. c, Top occurring DEGs from GO terms in b. d, Top cell type-specific BP and MF enrichR GO terms of the PTSD cell type-specific DEGs. e, Comparison of snRNA-seq average MAST log2FC values to bulk RNA log2FC values (r = 0.69) for PTSD snDEGs. f, Directional consistency of PTSD snDEGs with Chatzinakos PTSD genes. Lighter bar represents PTSD snDEGs. Darker bar represents overlap with Chatzinakos PTSD genes. g, Directional consistency of MDD snDEGs with Chatzinakos MDD genes. Bar represents MDD snDEGs. Dark shade represents overlap with Chatzinakos MDD genes.
Extended Data Fig. 4
Extended Data Fig. 4. Systematic comparisons of PTSD versus MDD.
a, Binary plot of 1,918 MDD snDEGs indicating occurrence of DEG across cell types. b, Correlation of snRNA-seq average MAST log2FC values to bulk RNA log2FC values (r = 0.72) for MDD snDEGs. c, Heatmap of MAST log2FC values of the top MDD snDEGs per cell type (top) and corresponding values from bulk RNA-seq (bottom). d, Overlap between PTSD snDEGs and snMDD DEGs across cell types. e, RRHO p-value heatmaps showing high enrichment in concordant quadrants and lack of enrichment in discordant quadrants between PTSD and MDD. f, RRHO odds ratio heatmaps showing high enrichment in concordant quadrants and minimal enrichment in discordant quadrants between PTSD and MDD. g, Overlap among PTSD, PTSD (+MDD), and PTSD (-MDD) vs CON up- and down-regulated DEGs across cell types.
Extended Data Fig. 5
Extended Data Fig. 5. Xenium spatial transcriptomic analysis.
a, Total and unique transcripts per cell for scXenium (top) and per nucleus for snXenium (bottom). b, Cell type spatial co-localization within the tissue section. c, CON and PTSD slides showing nuclei annotated by seven canonical cell types (top) and corresponding H&E images (bottom). Scale bar=1 mm. d, Correlation of MAST log2FC values between snXenium and snRNA for overlapping DEGs across all cell types (r = 0.62). e, Correlation of MAST log2FC values between scXenium and snRNA for overlapping DEGs across all cell types (r = 0.61). f, IN PTSD vs CON volcano plot of snXenium MAST results. DEGs that are labeled and outlined in black overlap with snRNA-seq MAST DEGs. g, CXCL14 log-normalized counts comparing CON and PTSD across cell types. h, CON slide showing individual CXCL14 transcripts in dark green and nuclei with their corresponding cell type colors in a lighter shade (IN = light green). Scale bar=1 mm. CON inset zooms 4X to show individual IN expression. i, PTSD slide showing individual CXCL14 transcripts in dark green and nuclei with their corresponding cell type colors in a lighter shade (IN = light green). Scale bar=1 mm. PTSD inset zooms 4X to show individual IN expression).
Extended Data Fig. 6
Extended Data Fig. 6. Cell-to-cell communication differences between PTSD and MDD.
a, Circle plots showing the differential sender signaling of PTSD versus CON and MDD versus CON interactions. Note differences in sending communication from the MG cell type. b, Heatmaps showing the differential pathway interactions from the MG cell type to all receiving cell types. Note the highest differences found in the SPP1 pathway between PTSD and MDD. c, Schematic of animal behavior experimental timeline. d, Daily weight changes in control versus SPS animals. SPS occurred on Day 0. SPS leads to significant weight loss in mice compared to control. 2-way ANOVA with Bonferroni’s multiple comparison tests. Control versus SPS group: p = 0.01, Day 1: p = 0.005, Day 2: p = 0.02. ##p < 0.01, #p < 0.05. Control: n = 15 samples, SPS: n = 16 samples. Error bar = standard error of the mean (SEM). e, Difference in information flow, defined by signaling summed across all sending and receiving cell types, of the top 15 most different neurocircuit signals between PTSD and CON individuals. Red bars indicate increased signaling strength, while blue bars indicate decreased signaling strength in PTSD samples (P < 0.1). f, Circos plots of Glu-GRM5, CRH-CRHR1, CORT-SSTR2, and Glu-GRM7 communication signals between PTSD and CON individuals. Source data
Extended Data Fig. 7
Extended Data Fig. 7. ATAC peak features in PTSD prefrontal cortex.
a, Marker peak heatmap showing high degree of cell type specificity (log2FC > 0.7, FDR < 0.01) in snATAC peaks. b, Jaccard similarity matrix showing the degree of overlap in peaks across cell types ranging from 0 (no overlap) to 1 (complete overlap). EXN and IN, and OLG and OPC share high similarity. c, Percentage overlap of snATAC peaks across cell types and bulk peaks at different overlap thresholds. d, Overlap of CLG-DEGs across cell types. EXN and IN and END, AST, and MG have high overlap.
Extended Data Fig. 8
Extended Data Fig. 8. Multiome peak features in PTSD prefrontal cortex.
a, snMultiome peak-to-gene links side by side heatmap. b, Stacked barplot showing number of peaks in each cell type (7) separated by genomic feature. c, Stacked barplot showing number of peaks in each subtype (14) separated by genomic category. d, Percentage overlap of snMultiome peaks across cell types and bulk peaks at different overlap thresholds. e, Percentage overlap of snMultiome peaks across subtypes and bulk peaks at different overlap thresholds. f, Jaccard similarity matrix showing the degree of overlap of snMultiome cell type peaks. g, Jaccard similarity matrix showing the degree of overlap of snMultiome subtype peaks. h, Overlap ratio of snATAC and snMultiome cell type peaks using a minimum overlap of one nucleotide.
Extended Data Fig. 9
Extended Data Fig. 9. Cell type-specific TF binding regulation in PTSD.
a, TF motif enrichment heatmap of highly enriched TFs for each cell type. b, UMAP of EGR2 chromVAR deviation scores. c, Tn5 bias-subtracted TF footprinting for EGR2 in EXN CON (gray) and EXN PTSD cells (red). The TF motif logo is shown above the footprint. d, TF regulatory network of EXN TF-CRE-Gene links for TFs EGR2, SMARCC1, and TAL2. Peak-to-gene correlation>0.7 was employed in generating the network. TFs in dark red, upregulated DEGs in red, downregulated DEGs in blue, PTSD GWAS genes in yellow, and iPSC DEGs in pink. e, Matrix showing overlap of DEGs regulated by the top 20 enriched TFs in EXN. More than half of the TFs are IEGs. f, UMAP of TFAP4 chromVAR deviation scores. g, Tn5 bias-subtracted TF footprinting for TFAP4 in IN CON cells (gray) and IN PTSD cells (red). The TF motif logo is shown above the footprint. h, TF regulatory network of IN TF-CRE-Gene links for TFs TFAP4, WT1, and ZNF238. Peak-to-gene correlation>0.6 was employed in generating the network.
Extended Data Fig. 10
Extended Data Fig. 10. PTSD risk loci fine-mapping.
a, Lollipop plot showing LDSC enrichment of various GWAS traits comparing snATAC peaks (colored dots) versus bCREs (gray dots). The cell type with the highest enrichment for the trait is shown with its corresponding color. b, PIP values versus negative log-transformed GWAS p-values of SNPs that lie within CREs. c, Cis-regulatory architecture for OPCML in IN for re-experiencing GWAS. d, Cis-regulatory architecture for EGR3 in IN for TotalPCL. MVP SNP rs10105545 (PIP = 0.017) has high LD with top credible SNP rs1059592 (R2 = 0.92). e, Cis-regulatory architecture for CAMKV in EXN for re-experiencing. MVP SNP rs2777888 (PIP = 0.012) has high LD with top credible SNP rs9821675 (R2 = 0.99). f, Cis-regulatory architecture for CAMKV in EXN for TotalPCL. MVP SNP rs2777888 (PIP = 0.002) has high LD with second credible SNP rs11716575 (R2 = 0.81). g, Cis-regulatory architecture for TCF4 in IN for re-experiencing. MVP SNP rs35371867 (PIP = 0.100) has moderate LD with second credible SNP rs35371867 (R2 = 0.32). h, Cis-regulatory architecture for CRHR1 in IN for TotalPCL.

References

    1. Ressler, K. J. et al. Post-traumatic stress disorder: clinical and translational neuroscience from cells to circuits. Nat. Rev. Neurol.18, 273–288 (2022). - PMC - PubMed
    1. McLaughlin, K. A. et al. Subthreshold posttraumatic stress disorder in the World Health Organization world mental health surveys. Biol. Psychiatry77, 375–384 (2015). - PMC - PubMed
    1. Bromet, E., Sonnega, A. & Kessler, R. C. Risk factors for DSM-III-R posttraumatic stress disorder: findings from the National Comorbidity Survey. Am. J. Epidemiology147, 353–361 (1998). - PubMed
    1. Afifi, T. O., Asmundson, G. J. G., Taylor, S. & Jang, K. L. The role of genes and environment on trauma exposure and posttraumatic stress disorder symptoms: a review of twin studies. Clin. Psychol. Rev.30, 101–112 (2010). - PubMed
    1. Stein, M. B. et al. Genome-wide association analyses of post-traumatic stress disorder and its symptom subdomains in the Million Veteran Program. Nat. Genet.53, 174–184 (2021). - PMC - PubMed

MeSH terms