Advancing atomic electron tomography with neural networks
- PMID: 40533670
- PMCID: PMC12177128
- DOI: 10.1186/s42649-025-00113-7
Advancing atomic electron tomography with neural networks
Abstract
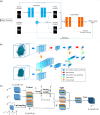
Accurate determination of three-dimensional (3D) atomic structures is crucial for understanding and controlling the properties of nanomaterials. Atomic electron tomography (AET) offers non-destructive atomic imaging with picometer-level precision, enabling the resolution of defects, interfaces, and strain fields in 3D, as well as the observation of dynamic structural evolution. However, reconstruction artifacts arising from geometric limitations and electron dose constraints can hinder reliable atomic structure determination. Recent progress has integrated deep learning, especially convolutional neural networks, into AET workflows to improve reconstruction fidelity. This review highlights recent advances in neural network-assisted AET, emphasizing its role in overcoming persistent challenges in 3D atomic imaging. By significantly enhancing the accuracy of both surface and bulk structural characterization, these methods are advancing the frontiers of nanoscience and enabling new opportunities in materials research and technology.
Keywords: 3D structural analysis; Atomic electron tomography; Neural network.
© 2025. The Author(s).
Conflict of interest statement
Declarations. Competing interests: The authors declare no competing interests.
Figures


Similar articles
-
Immunogenicity and seroefficacy of pneumococcal conjugate vaccines: a systematic review and network meta-analysis.Health Technol Assess. 2024 Jul;28(34):1-109. doi: 10.3310/YWHA3079. Health Technol Assess. 2024. PMID: 39046101 Free PMC article.
-
Health professionals' experience of teamwork education in acute hospital settings: a systematic review of qualitative literature.JBI Database System Rev Implement Rep. 2016 Apr;14(4):96-137. doi: 10.11124/JBISRIR-2016-1843. JBI Database System Rev Implement Rep. 2016. PMID: 27532314
-
Three-dimensional saline infusion sonography compared to two-dimensional saline infusion sonography for the diagnosis of focal intracavitary lesions.Cochrane Database Syst Rev. 2017 May 5;5(5):CD011126. doi: 10.1002/14651858.CD011126.pub2. Cochrane Database Syst Rev. 2017. PMID: 28472862 Free PMC article.
-
Accreditation through the eyes of nurse managers: an infinite staircase or a phenomenon that evaporates like water.J Health Organ Manag. 2025 Jun 30. doi: 10.1108/JHOM-01-2025-0029. Online ahead of print. J Health Organ Manag. 2025. PMID: 40574247
-
A deep learning approach to direct immunofluorescence pattern recognition in autoimmune bullous diseases.Br J Dermatol. 2024 Jul 16;191(2):261-266. doi: 10.1093/bjd/ljae142. Br J Dermatol. 2024. PMID: 38581445
References
-
- V.R. Stamenkovic et al., Improved oxygen reduction activity on Pt3Ni(111) via increased surface site availability. Science. 315, 493–497 (2007) - PubMed
-
- Y. Ding, M. Chen, Nanoporous metals for catalytic and optical applications. MRS Bull. 34, 569–576 (2009)
-
- B. Lim et al., Pd-Pt bimetallic nanodendrites with high activity for oxygen reduction. Science. 324, 1302–1305 (2009) - PubMed
-
- X. Huang et al., High-performance transition metal–doped Pt3Ni octahedra for oxygen reduction reaction. Science. 348, 1230–1234 (2015) - PubMed
-
- N. Sharma, H. Ojha, A. Bharadwaj, D.P. Pathak, R.K. Sharma, Preparation and catalytic applications of nanomaterials: a review. RSC Adv. 5, 53381–53403 (2015)
Publication types
Grants and funding
LinkOut - more resources
Full Text Sources
