. 2025 Jun 19;197(7):767.
doi: 10.1007/s10661-025-14233-w.

Long-term vegetation dynamics in Spain's National Park Network: insights from remote sensing data

Affiliations

Long-term vegetation dynamics in Spain's National Park Network: insights from remote sensing data

Magí Franquesa et al. Environ Monit Assess. .

Abstract

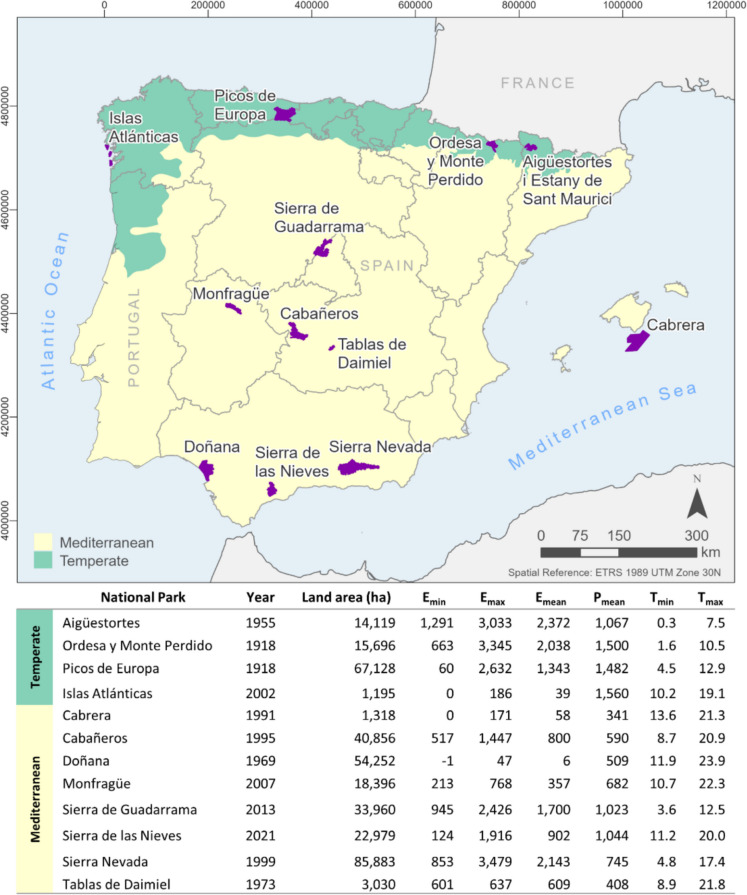
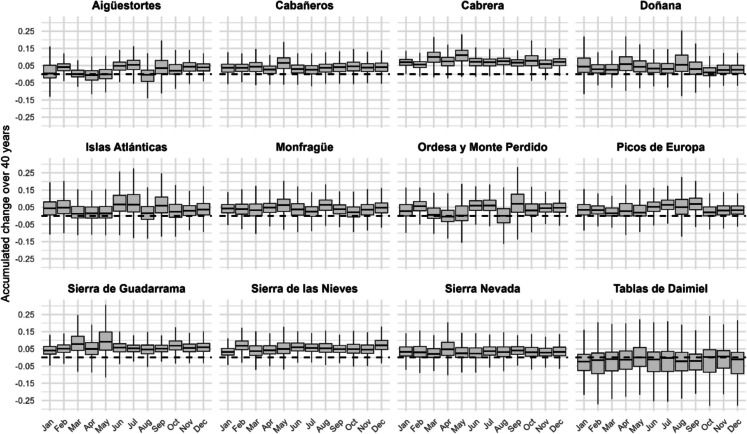
Understanding long-term vegetation dynamics in protected areas is crucial for assessing ecosystem resilience and informing adaptive management strategies. This study presents a comprehensive analysis of vegetation trends across Spain's National Park Network from 1984 to 2023, using Landsat imagery processed in Google Earth Engine. Twelve national parks, representing diverse biogeographical regions and ecosystems, were analyzed using vegetation indices such as NDVI, SAVI, kNDVI, and NDMI. The Mann-Kendall test and Theil-Sen slope estimator were employed to detect monotonic trends and quantify their magnitudes, respectively. Our results reveal a predominant increase in vegetation activity across most parks over the past four decades, though with notable spatial and seasonal variations influenced by topographic gradients, bioclimatic zones, and vegetation types. High-altitude parks exhibited strong seasonal dynamics, with positive trends concentrated during the growing season, whereas Mediterranean parks showed more consistent trends throughout the year. Conversely, wetland parks like Las Tablas de Daimiel displayed concerning negative trends, highlighting ecosystem vulnerabilities associated with hydrological stress. These findings underscore the importance of integrating high-resolution remote sensing data into long-term ecological monitoring programs to track ecosystem functioning and assess management practices in protected areas. Combining remote sensing with field observations is essential to support evidence-based conservation strategies in response to climate change and other anthropogenic pressures.

Keywords: Conservation management; Environmental monitoring; Forest expansion; Landscape dynamics; Protected areas; Spatiotemporal trends.


Conflict of interest statement

Declarations. Ethics approval: All authors have read, understood, and have complied as applicable with the statement on “Ethical responsibilities of Authors” as found in the Instructions for Authors. Competing interests: The authors declare no competing interests.

Figures

Fig. 1
Fig. 1
Location of the 12 national parks included in this study and the two biogeographical regions: Temperate (green) and Mediterranean (yellow). The table provides the designation year, land area (ha), minimum (Emin), maximum (Emax), and mean (Emean) elevation (m), mean annual precipitation (Pmean, mm), and mean minimum (Tmin) and maximum (Tmax) temperature (°C) for each park. Elevation data were derived from Spain’s 25-m resolution Digital Terrain Model (MDT25) and climate data from the interpolation of observational data from meteorological stations
Fig. 2
Fig. 2
Percentage distribution of natural vegetation systems across 11 Spanish national parks (Sierra de las Nieves cartography is not available). Each bar represents the proportion of various natural systems present within each park, as categorized by specific vegetation types (Table S1). Only categories that occupy more than 5% of the total park area are shown, with the remaining categories combined into an “Others” category. Abbreviations: AlpScrGr, Alpine Scrublands and Grasslands; AlpConF, Alpine coniferous forest; TempDecF, Temperate broadleaf deciduous forest; SMedMarF, Semi-Mediterranean Marcescent Forests; MedConF, Mediterranean coniferous forests; MedSclF, Mediterranean sclerophyllous forest; AtlScrub, Atlantic scrublands; MedScrub, Mediterranean scrublands; AridScr, Hyperxerophilous Garrigues and Scrublands; Grass, Mediterranean and Atlantic grasslands; RockScreeVeg, Rocky and Scree vegetation; BareArea, Bare areas; Reforestation, Reforestation; Dehesa, Dehesas, woody savanna; Crop, Crops; HaloVeg, Halophilous vegetation; HydroRipVeg, Hydrophilous and riparian vegetation; SaltMar, Salt marshes; WaterSurf, Water surfaces
Fig. 3
Fig. 3
Monthly NDVI (Normalized Difference Vegetation Index) maps of the Doñana National Park for the year 1988. a The original NDVI values before gap filling, and (b) The NDVI values after applying the gap-filling procedure
Fig. 4
Fig. 4
Monthly mean values and standard deviation (shaded areas) of vegetation indices (kNDVI, NDMI, NDVI, and SAVI) for 12 Spanish national parks over a period of 40 years. The x-axis represents months (January to December), and the y-axis indicates the mean index values. Each panel corresponds to a specific national park, with fixed y-axis scales for easier inter-park comparison. Seasonal patterns are evident, with higher index values in spring and summer, reflecting vegetation growth dynamics
Fig. 5
Fig. 5
Monthly mean values of the SAVI index for 12 Spanish national parks over a period of 40 years. The x-axis represents months (January to December), and the y-axis indicates the mean SAVI values. Each panel corresponds to a specific national park, with variable y-axis scales to better highlight seasonal vegetation dynamics
Fig. 6
Fig. 6
Spatial distribution of vegetation trends based on the SAVI index for the month of peak vegetation activity in 12 Spanish national parks. Each panel displays two maps: (1) the total magnitude of change over the 40-year period (left), represented using a continuous color scale, and (2) the classification of trends (right), showing significant positive trends (+ Sig.), significant negative trends (− Sig.), and non-significant trends (+ NS, − NS). The title of each panel indicates the national park, the vegetation index (SAVI), and the corresponding month. Gaps observed in some areas, particularly in high mountain regions, correspond to pixels with very few observations in the historical series, which could not be filled
Fig. 7
Fig. 7
Accumulated change in SAVI over 40 years (1982–2022) across 12 Spanish national parks. The boxplots display the distribution of accumulated changes for each month, calculated using all valid pixels, including both significant and non-significant trends. The y-axis shows the magnitude of the changes, with positive values indicating an increase and negative values a decrease in SAVI. The dashed horizontal line at y = 0 represents no change. Scales on the y-axis are adjusted dynamically to each park to better visualize the variability in trends. Outliers are excluded for clarity
Fig. 8
Fig. 8
Monthly distribution of significant and non-significant SAVI trends across 12 Spanish national parks. Each bar shows the percentage of pixels within each park for a given month categorized as follows: significant positive trends (dark green), non-significant positive trends (light green), non-significant negative trends (light red), and significant negative trends (dark red). The trends are calculated for each park individually, showing seasonal and spatial variability in vegetation dynamics
Fig. 9
Fig. 9
Distribution of significant positive vegetation trends classified by magnitude of change (SAVI) across 12 Spanish national parks on a monthly basis. The magnitude of change is expressed as the total slope change over 40 years, classified into three categories: low (Z-score < 0.5), medium (0.5 ≤ Z-score < 1.5), and high (Z-score ≥ 1.5). Each bar represents the proportion of significant positive trends for each month, showing how the strength of positive trends varies throughout the year across different parks
Fig. 10
Fig. 10
Proportion of significant positive SAVI trends by bioclimatic zone across seven Spanish national parks. Gray bars represent the proportional area of each bioclimatic zone within each park, while the colored bars indicate the percentage of pixels with significant positive trends in January (blue) and July (red). Only parks with at least two bioclimatic zones are included
Fig. 11
Fig. 11
Trends in the SAVI vegetation index. The figure shows the proportion of positive significant pixels (%) across natural vegetation systems for each national park during January (blue) and July (red). Each bar represents the percentage of pixels within a specific vegetation category exhibiting positive significant trends. The numbers on the bars indicate the mean slope of change over the entire study period for each vegetation system and month. Abbreviations: AlpScrGr, Alpine Scrublands and Grasslands; AlpConF, Alpine coniferous forest; TempDecF, Temperate broadleaf deciduous forest; SMedMarF, Semi-Mediterranean Marcescent Forests; MedConF, Mediterranean coniferous forests; MedSclF, Mediterranean sclerophyllous forest; AtlScrub, Atlantic scrublands; MedScrub, Mediterranean scrublands; AridScr, Hyperxerophilous Garrigues and Scrublands; Grass, Mediterranean and Atlantic grasslands; RockScreeVeg, Rocky and Scree vegetation; BareArea, Bare areas; Reforestation, Reforestation; HydroRipVeg, Hydrophilous and riparian vegetation; SaltMar, Salt marshes; WaterSurf, Water surfaces. Only vegetation categories covering more than 10% of the national park surface are included

References

    1. Adell-Michavila, M., Vicente-Serrano, S. M., Montorio Llovería, R., Cai, Z., & Eklundh, L. (2024). Analysis of plant phenology dynamics in Spain from 1983 to 2020 using satellite imagery. Cuadernos de Investigación Geográfica,50(1), 145–178. 10.18172/cig.5739
    1. Aklilu Tesfaye, A., & Gessesse Awoke, B. (2021). Evaluation of the saturation property of vegetation indices derived from sentinel-2 in mixed crop-forest ecosystem. Spatial Information Research,29(1), 109–121. 10.1007/s41324-020-00339-5
    1. Alados, C. L., Komac, B., Bueno, C. G., Gartzia, M., Escós, J., Gómez García, D., et al. (2011). Modelización de la matorralización de los pastos del Parque Nacional de Ordesa y Monte Perdido y su relación con el cambio global. In L. Ramírez and B. Asensio (Eds.), Proyectos de investigación en parques nacionales: 2007–2010 (pp. 101–121). Organismo Autónomo de Parques Nacionales, Ministerio de Medio Ambiente y Medio Rural y Marino.
    1. Alcaraz-Segura, D., Baldi, G., Durante, P., & Garbulsky, M. (2008a). Análisis de la dinámica temporal del NDVI en áreas protegidas: Tres casos de estudio a distintas escalas espaciales, temporales y de gestión. Ecosistemas,17(3).
    1. Alcaraz-Segura, D., Cabello, J., Paruelo, J. M., & Delibes, M. (2008b). Trends in the surface vegetation dynamics of the national parks of Spain as observed by satellite sensors. Applied Vegetation Science,11(4), 431–440. 10.3170/2008-7-18522

LinkOut - more resources