

Human serum albumin-based KBiF4@HSA nanoclusters for dual-energy computed tomography and glutathione-scavenging radiotherapy of breast cancer
- PMID: 40533758
- PMCID: PMC12175373
- DOI: 10.1186/s12951-025-03530-8
Human serum albumin-based KBiF4@HSA nanoclusters for dual-energy computed tomography and glutathione-scavenging radiotherapy of breast cancer
Abstract
Background: Breast cancer remains the most common malignancy among women worldwide. While traditional computed tomography (CT) scans and image-guided radiotherapy are widely used for breast cancer diagnosis and treatment, their efficacy is often limited.
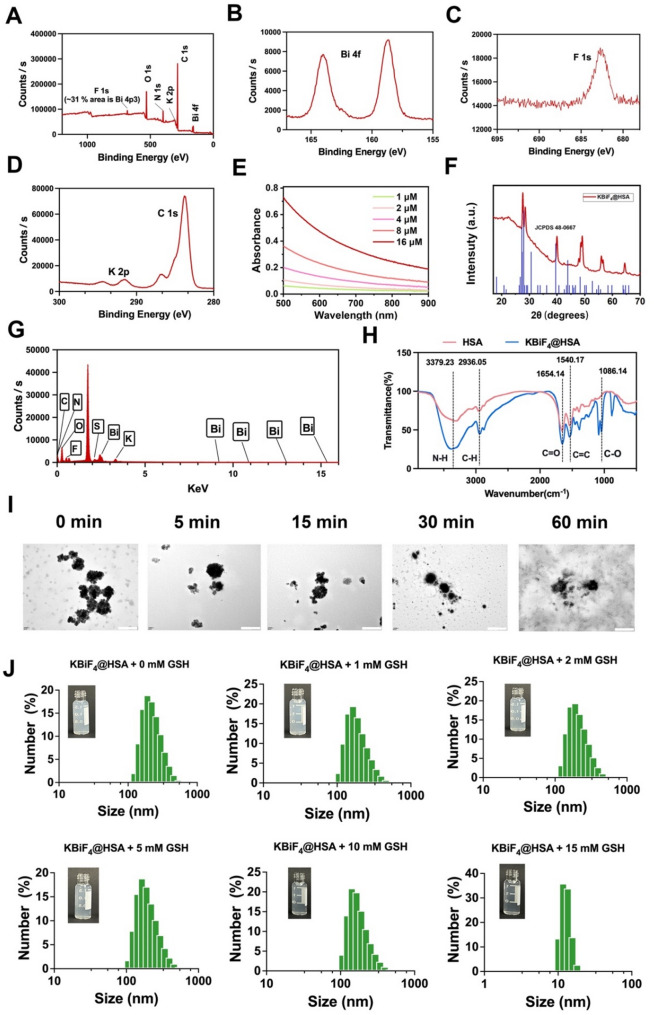
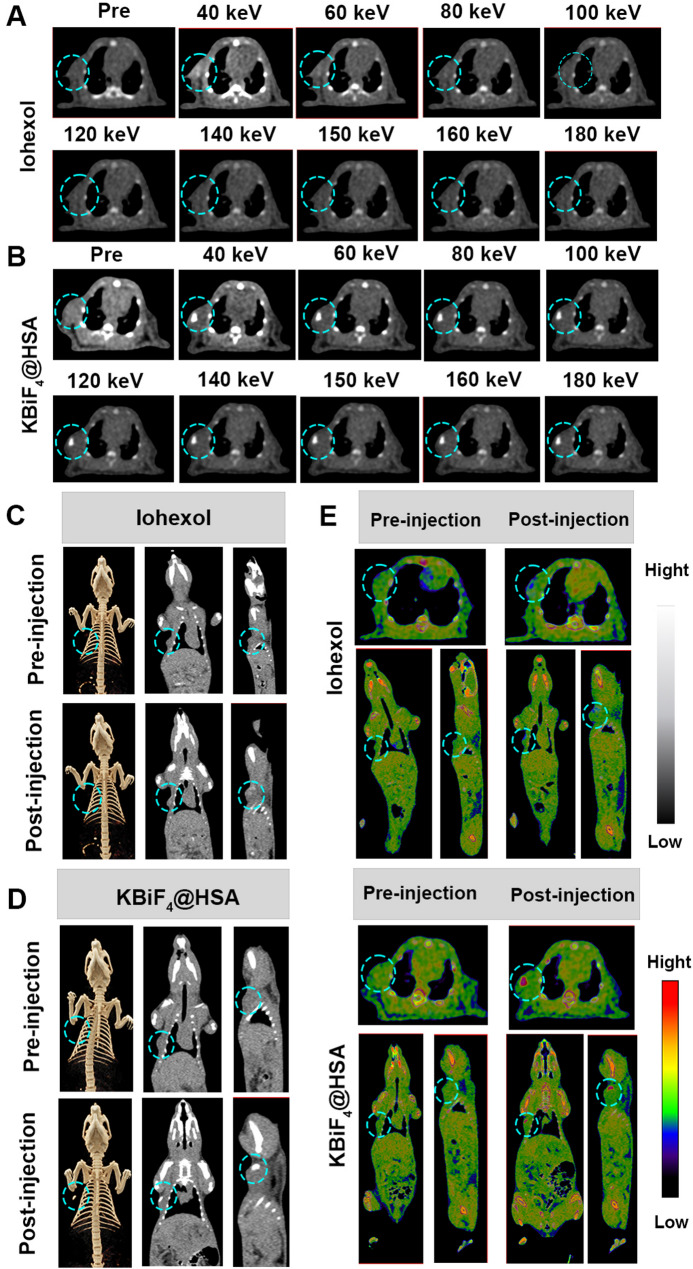
Methods and results: In this study, we successfully synthesized human serum albumin (HSA)-based KBiF4 nanoclusters through a simple one-pot biomimetic mineralization strategy. Compared to the clinical contrast agent iohexol, KBiF4@HSA significantly enhances dual-energy CT (DECT) imaging contrast at high keV levels, offering improved diagnostic accuracy for breast cancer. Furthermore, KBiF4@HSA exhibits a remarkable ability to scavenge elevated glutathione (GSH) levels and promote reactive oxygen species (ROS) generation. When combined with radiotherapy, KBiF4@HSA substantially increases X-ray dose deposition at tumor sites, leading to enhanced DNA damage and suppression of breast cancer progression. Importantly, KBiF4@HSA demonstrates excellent biocompatibility in vivo, with no significant tissue damage or inflammation observed.
Conclusions: This study presents a novel approach for the development of biocompatible DECT contrast agents and radiosensitizers, offering a promising strategy to enhance breast cancer diagnosis and treatment. However, the efficacy of this approach needs to be further validated across diverse breast cancer subtypes to ensure its broad applicability, which emphasizes the necessity for continued research to fully translate this innovative technology into clinical practice.
Keywords: Bismuth; Breast cancer; Contrast agents; Dual-energy CT; Radiotherapy.
© 2025. The Author(s).
Conflict of interest statement
Declarations. Ethical approval: The ethical review board of the XinHua Hospital Affiliated to Shanghai JiaoTong University School of Medicine, China, approved the experiment protocol and strictly followed its guidelines (Ethical approval number: XHEC-F-2024-014). Consent for publication: All authors read and agreed to submit the manuscript. Competing interests: The authors declare no competing interests.
Figures


Similar articles
-
Molecular feature-based classification of retroperitoneal liposarcoma: a prospective cohort study.Elife. 2025 May 23;14:RP100887. doi: 10.7554/eLife.100887. Elife. 2025. PMID: 40407808 Free PMC article.
-
Dual-energy CT Radiomics Combined with Quantitative Parameters for Differentiating Lung Adenocarcinoma From Squamous Cell Carcinoma: A Dual-center Study.Acad Radiol. 2025 Mar;32(3):1675-1684. doi: 10.1016/j.acra.2024.09.024. Epub 2024 Sep 25. Acad Radiol. 2025. PMID: 39327138
-
Tetraphenylethylene-indole as a novel fluorescent probe for selective and sensitive detection of human serum albumin (HSA) in biological matrices and monitoring of HSA purity and degradation.Talanta. 2025 May 1;286:127471. doi: 10.1016/j.talanta.2024.127471. Epub 2024 Dec 27. Talanta. 2025. PMID: 39736207
-
Assessing the comparative effects of interventions in COPD: a tutorial on network meta-analysis for clinicians.Respir Res. 2024 Dec 21;25(1):438. doi: 10.1186/s12931-024-03056-x. Respir Res. 2024. PMID: 39709425 Free PMC article. Review.
-
Defining disease severity in atopic dermatitis and psoriasis for the application to biomarker research: an interdisciplinary perspective.Br J Dermatol. 2024 Jun 20;191(1):14-23. doi: 10.1093/bjd/ljae080. Br J Dermatol. 2024. PMID: 38419411 Free PMC article. Review.
References
-
- Barzaman K, Karami J, Zarei Z, Hosseinzadeh A, Kazemi MH, Moradi-Kalbolandi S, Safari E. Farahmand, breast cancer: biology, biomarkers, and treatments. Int Immunopharmacol. 2020l;84:106535. - PubMed
-
- Pinker K, Chin J, Melsaether AN, Morris EA, Moy L. Precision medicine and radiogenomics in breast cancer: new approaches toward diagnosis and treatment. Radiology. 2018;287:732–47. - PubMed
-
- Dialani V, Chadashvili T, Slanetz PJ. Role of imaging in neoadjuvant therapy for breast cancer. Ann Surg Oncol. 2015;22:24–1416. - PubMed
-
- Greffier J, Villani N, Defez D, Dabli D, Si-Mohamed S. Spectral CT imaging: technical principles of dual-energy CT and multi-energy photon-counting CT. Diagn Interv Imaging. 2023;104:167–77. - PubMed
MeSH terms
Substances
Grants and funding
LinkOut - more resources
Full Text Sources
Medical
