. 2025 Jun 18;23(1):239.
doi: 10.1186/s12957-025-03893-0.

Increased GPR35 expression is correlated with poor prognosis in prostate cancer

Affiliations

Increased GPR35 expression is correlated with poor prognosis in prostate cancer

Tianyi Zhang et al. World J Surg Oncol. .

Abstract

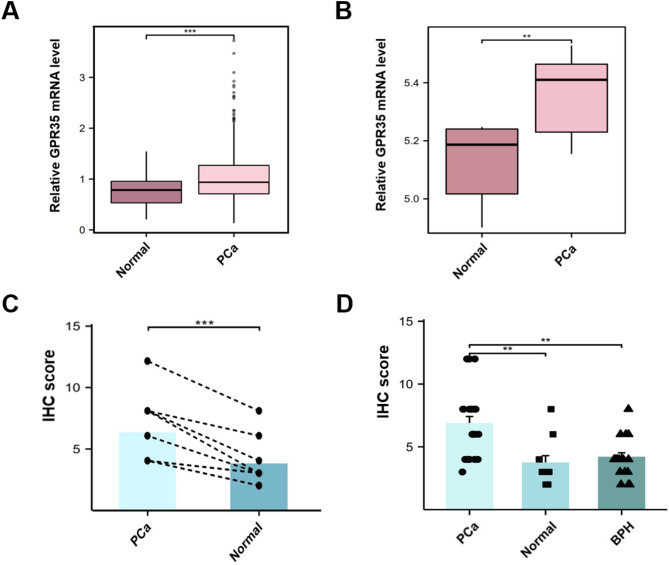
Background: G-protein-coupled receptor 35 (GPR35) has been reported to be overexpressed in several types of human cancers, playing essential roles in tumorigenesis and development. However, its expression and prognostic value in Prostate cancer (PCa) remain unclear. This study aims to investigate the expression of GPR35 and its prognostic value in PCa.

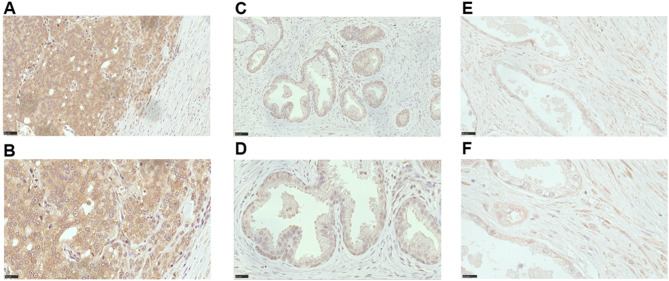
Methods: The expression of GPR35 was analyzed using the public database and validated by immunohistochemistry (IHC) in PCa tissues. Subsequently, the correlation between GPR35 expression and the clinical characteristics was evaluated using the Chi-squared test. Kaplan-Meier and Cox proportional hazards regression models were used to analyze the data. Hazard Ratios (HR) and 95% confidence intervals (CI) were calculated for each factor.

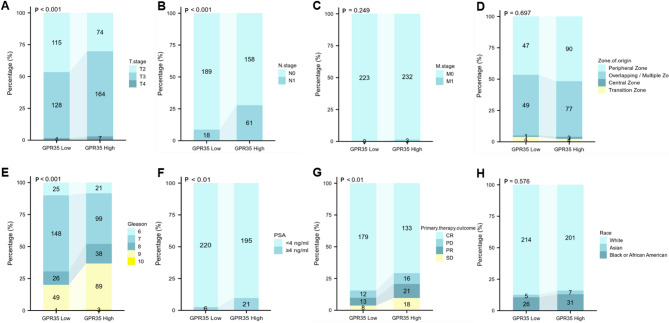
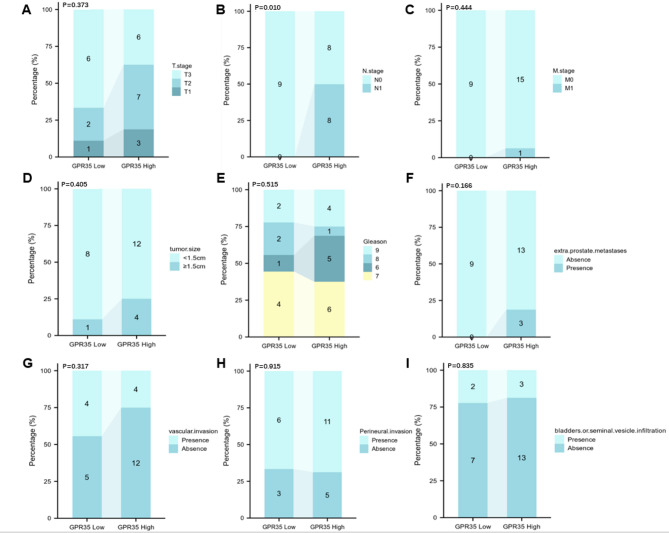
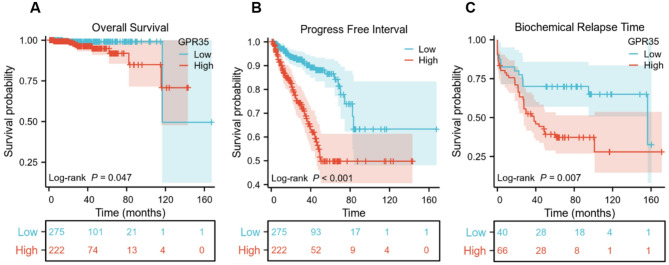
Results: GPR35 messenger RNA (mRNA) and protein expression were confirmed to be overexpressed in PCa tissue samples. Furthermore, high GPR35 mRNA expression was correlated with clinical tumor stage (T stage) (P < 0.001), lymph node metastasis (P < 0.001), primary therapy outcome (P = 0.009), residual tumor (P < 0.001), prostate-specific antigen (PSA) levels (P = 0.004), and Gleason score (P < 0.001). IHC analysis also confirmed that GPR35 overexpression was associated with lymph node metastasis (P = 0.010). Additionally, Kaplan-Meier analysis showed that PCa patients with high expression of GPR35 were associated with shorter overall survival (OS) (HR: 3.370, 95% CI: 1.085-10.470, P = 0.047), progress free interval (PFI) (HR: 3.385, 95% CI: 2.234-5.131, P < 0.001), and biochemical relapse time (BCR) (HR: 2.229, 95% CI: 1.308-3.801, P = 0.007). Moreover, univariate Cox regression analyses suggested that T stage (P < 0.001), lymph node involvement (P = 0.046), serum PSA levels (P = 0.013), Gleason score (P < 0.001), and GPR35 expression (P < 0.001) were unfavorable prognostic factors for PCA patients. Multivariate Cox regression analysis showed that GPR35 was an independent poor prognostic factor of PCa patients (HR: 1.915, 95%CI: 1.368-2.682).

Conclusion: Overexpression of GPR35 is associated with poor clinical prognosis, suggesting that GPR35 may serve as a potential prognostic biomarker for PCa.

Clinical trial number: Not applicable.

Keywords: Biomarkers; GPR35; Prognosis; Prostate; Prostate cancer.


Conflict of interest statement

Declarations. Ethics approval and consent to participate: This study was approved by the Ethics Committee of the General Hospital of Xinjiang Military Region of the Chinese People’s Liberation Army and conducted in accordance with the 1996 Declaration of Helsinki. The Ethics Committee of the General Hospital of Xinjiang Military Region of the Chinese People’s Liberation Army waived informed consent from participants because this study involved routinely collected medical data that were managed anonymously at all stages, including the data cleaning and statistical analysis stages. Consent for publication: Not applicable. Competing interests: The authors declare no competing interests.

Figures

Fig. 1
Fig. 1
GPR35 expression was upregulated in PCa tissues. (A) Relative GPR35 mRNA expression in PCa patient tissues versus normal samples from the TCGA database. (B) Relative GPR35 mRNA expression in PCa patient tissues versus normal samples in GSE3325 from the GEO database. (C) GPR35 protein expression in PCa versus paired adjacent normal tissues was detected by IHC. (D) Comparison of GPR35 protein expression levels in PCa, adjacent normal tissues, and BPH tissues by IHC. *P < 0.05, **P < 0.01, ***P < 0.001
Fig. 2
Fig. 2
Immunostaining of GPR35 in PCa, adjacent normal, and BPH tissues. (A and B) Immunostaining showed strong positive GPR35 expression in PCa. (C and D) Immunostaining showed moderate positive GPR35 expression in BPH tissues. (E and F) Representative images of adjacent normal prostate tissue showing low levels of GPR35 expression. Magnification, ×100 and ×200
Fig. 3
Fig. 3
Association of GPR35 mRNA expression with clinicopathologic features of 499 PCa patients in TCGA. Panels A-H display the distribution of GPR35 expression levels across various clinical variables, including T stage (A), N stage (B), M stage (C), zone of origin (D), Gleason score (E), PSA levels (F), primary therapy outcome (G), and race (H)
Fig. 4
Fig. 4
Immunohistochemical expression of GPR35 and its association with clinicopathologic variables in PCa. Panels A-I display the distribution of GPR35 expression levels across various clinical variables, including T stage (A), N stage (B), M stage (C), tumor size (D), Gleason score (E), extra-prostate metastases (F), vascular invasion (G), perineural invasion (H), and bladder or seminal vesicle infiltration (I)
Fig. 5
Fig. 5
Kaplan-Meier survival analysis of (A) overall survival, (B) progress free interval, and (C) biochemical relapse time (GSE54460) for GPR35 expression in PCa
Fig. 6
Fig. 6
Analysis of the biological function of GPR35 in PCa. (A) A volcano plot of correlation coefficients of GPR35 with all other mRNAs in the prostate cancer mRNA expression profile using the Pearson correlation test. (B) Part of the bar chart for enriched GO items, only the 5 top GO terms are shown. The length of the bars is proportional to the number of genes. (C) Enrichment plots of KEGG pathways. The size of the nodes is proportional to the number of genes. (D) Construction and analysis of protein-protein interaction (PPI) network
Fig. 7
Fig. 7
Correlation of GPR35 expression with tumor mutational landscape and prognostic indicators in prostate cancer. (A) Mutation landscape of PCa samples with low GPR35 expression. (B) Mutation landscape of PCa samples with high GPR35 expression. (C) Correlation between GPR35 expression and TMB. (D) Survival probability based on TMB levels in PCa patients. (E) Survival probability in different TMB groups based on expression levels of GPR35

Similar articles

References

    1. Sung H, Ferlay J, Siegel RL, et al. Global Cancer statistics 2020: GLOBOCAN estimates of incidence and mortality worldwide for 36 cancers in 185 countries. CA Cancer J Clin. 2021;71(3):209–49. - PubMed
    1. Bray F, Ferlay J, Soerjomataram I, Siegel RL, Torre LA, Jemal A. Global cancer statistics 2018: GLOBOCAN estimates of incidence and mortality worldwide for 36 cancers in 185 countries. CA Cancer J Clin. 2018;68(6):394–424. - PubMed
    1. Chen W, Zheng R, Zeng H, Zhang S. The updated incidences and mortalities of major cancers in china, 2011. Chin J Cancer. 2015;34(11):502–7. - PMC - PubMed
    1. Li M, Hu M, Jiang L, Pei J, Zhu C. Trends in Cancer incidence and potential associated factors in China. JAMA Netw Open. 2024;7(10):e2440381. - PMC - PubMed
    1. Devos G, Devlies W, De Meerleer G, et al. Neoadjuvant hormonal therapy before radical prostatectomy in high-risk prostate cancer. Nat Rev Urol. 2021;18(12):739–62. - PubMed

MeSH terms