. 2025 Jun 18;44(1):177.
doi: 10.1186/s13046-025-03436-1.

The DCDC2/ENO1 axis promotes tumor progression and immune evasion in intrahepatic cholangiocarcinoma via activating FGL1-LAG3 checkpoint

Affiliations

The DCDC2/ENO1 axis promotes tumor progression and immune evasion in intrahepatic cholangiocarcinoma via activating FGL1-LAG3 checkpoint

Wenze Wan et al. J Exp Clin Cancer Res. .

Abstract

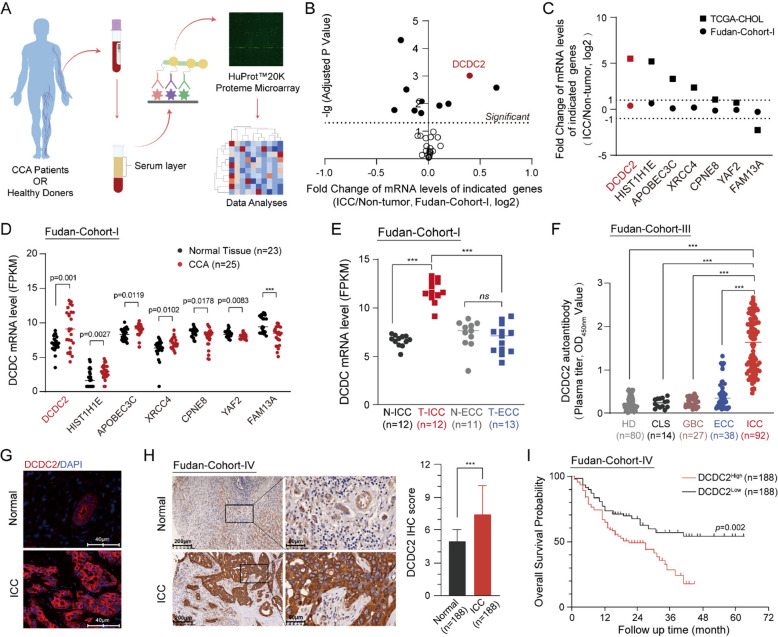
Background & aims: ICC is a malignant tumor that originates from the intrahepatic bile ducts with insidious symptoms and a poor prognosis. Early diagnosis methods and therapeutic targets are urgently needed for ICC.

Methods: We utilized a comprehensive set of analytical techniques to elucidate the role and mechanisms of DCDC2 in ICC. Our study included protein microarrays, transcriptome analysis, functional assays, immunofluorescence, dual-luciferase reporter assays, as well as xenograft models and humanized PBMC models.

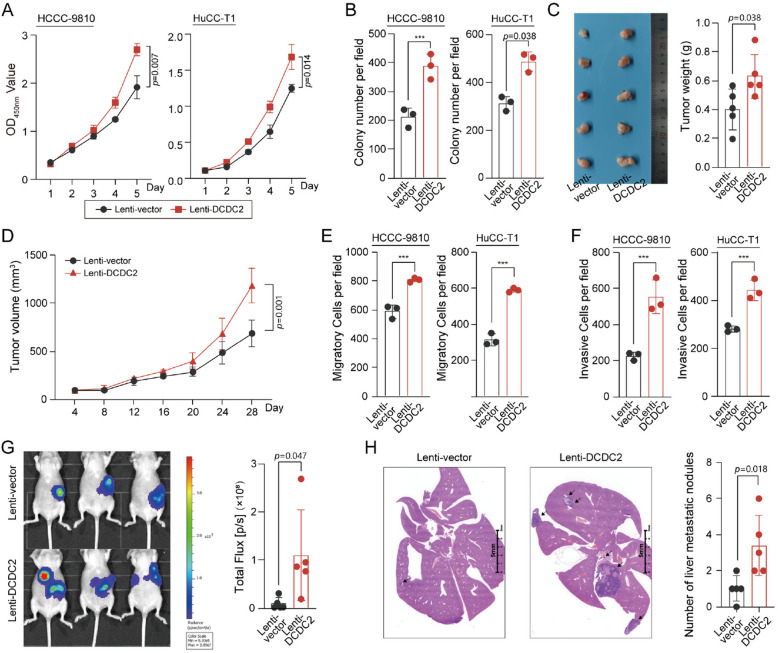
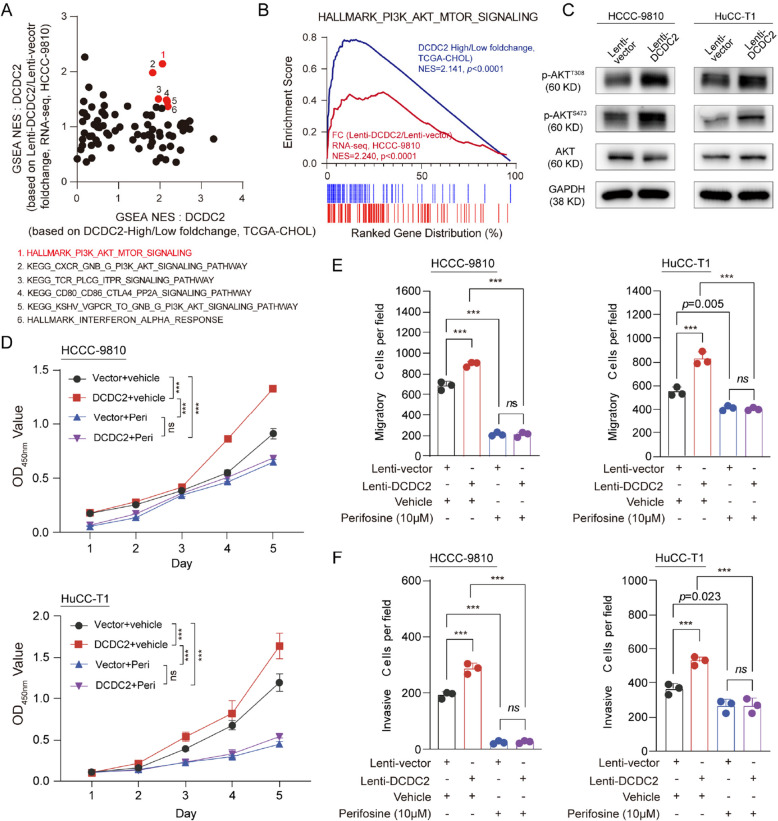
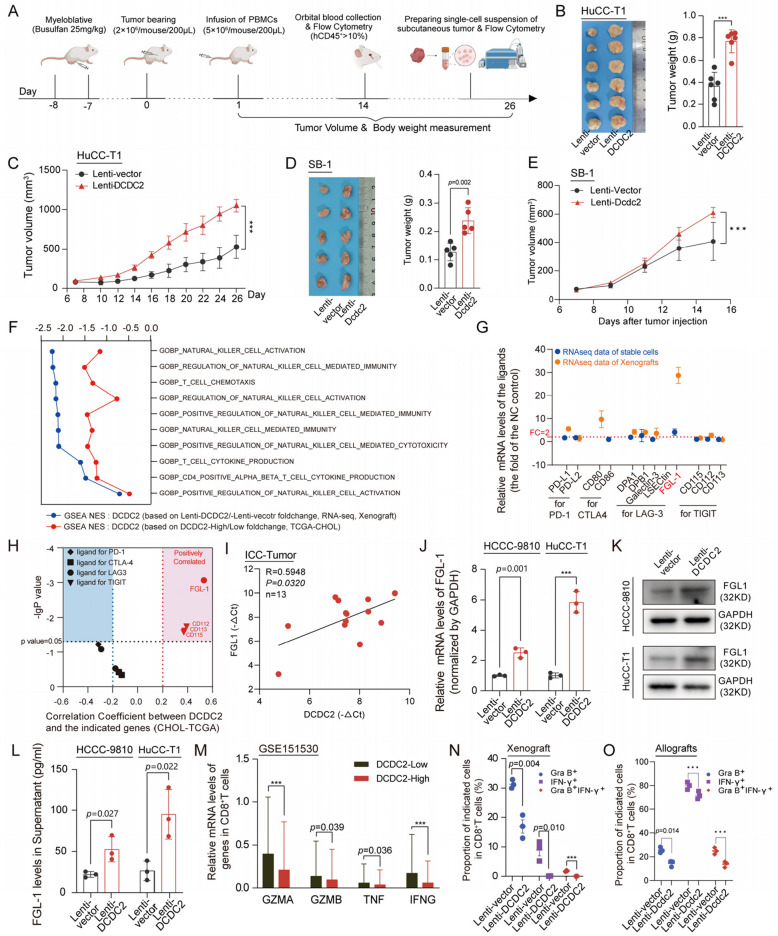
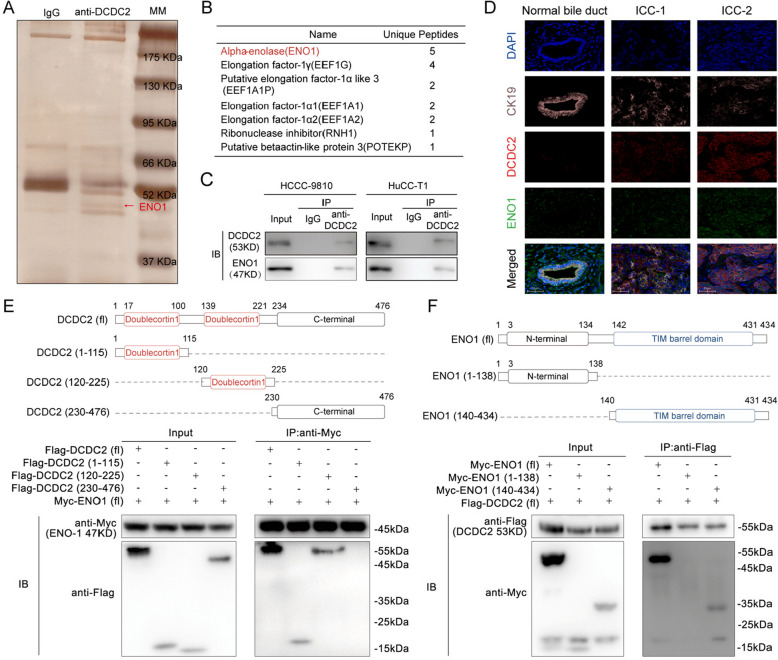
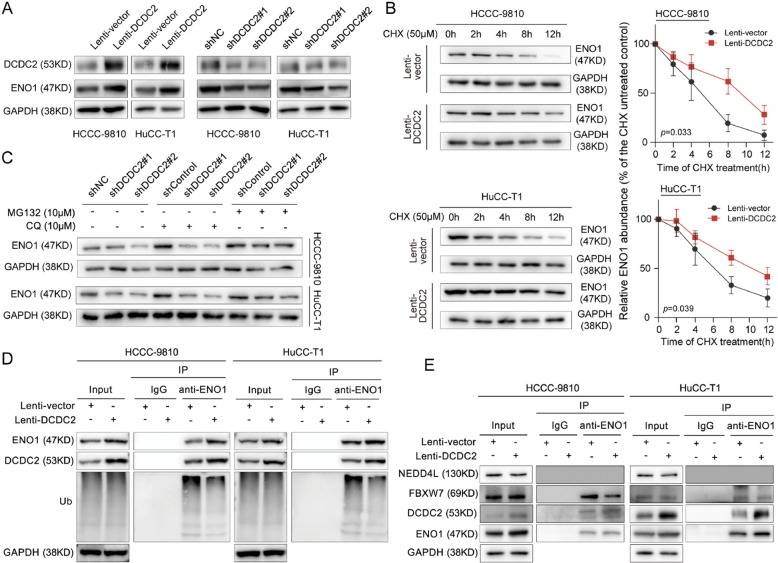
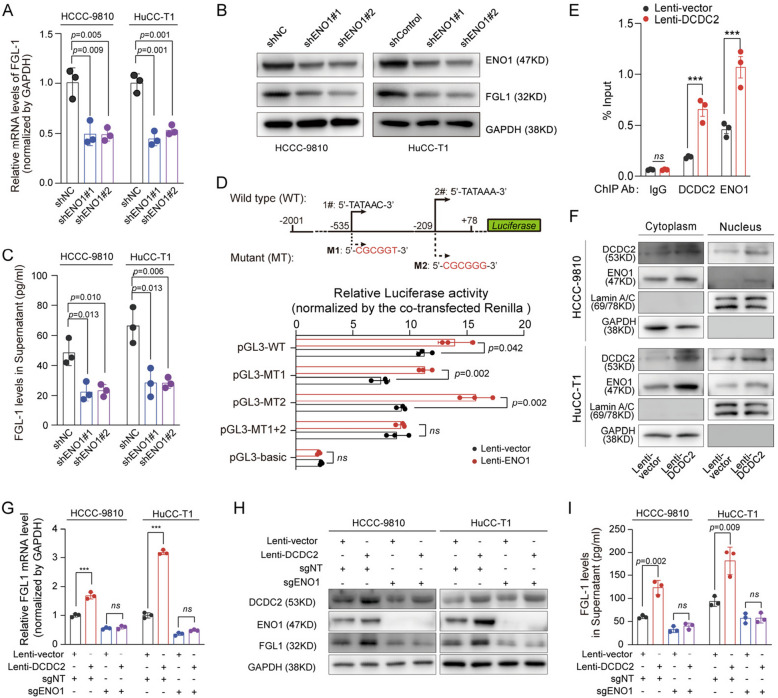
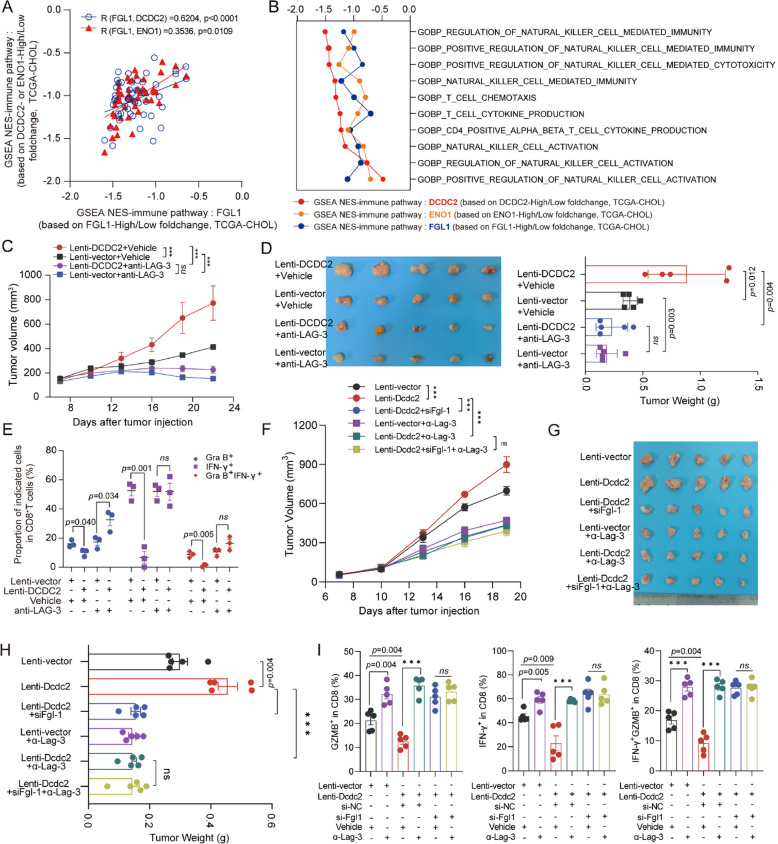
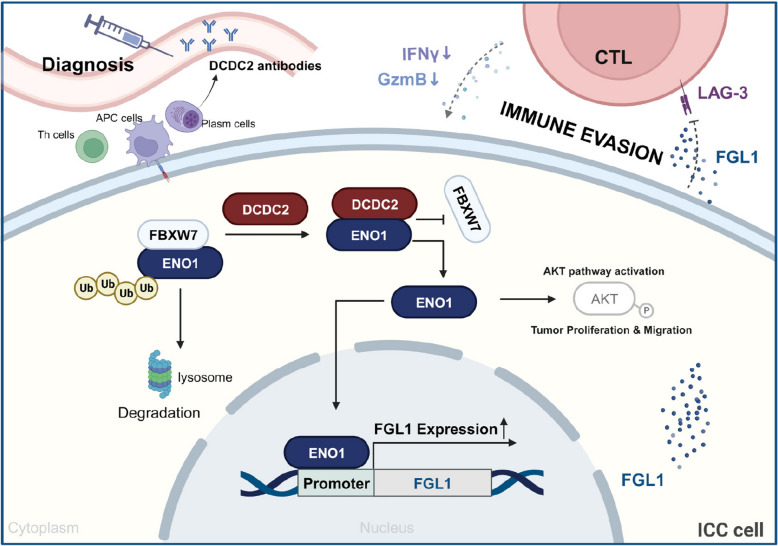
Results: Our study demonstrates that elevated levels of anti-DCDC2 autoantibodies in the serum of ICC patients indicate its potential utility as a diagnostic biomarker. Comprehensive in vitro and in vivo analyses reveal that DCDC2 promotes ICC proliferation, metastasis, and immune evasion. Mechanistically, DCDC2 stabilizes ENO1, resulting in enhanced AKT phosphorylation and increased expression of FGL1. Notably, elevated FGL1 levels significantly impair CD8+ T cell functionality via the FGL1-LAG3 axis.

Conclusion: Our findings position anti-DCDC2 autoantibody as a promising diagnostic biomarker for ICC, associated with poor prognostic outcomes, and elucidate its critical role in tumor growth and immune evasion through its interaction with ENO1.

Keywords: Doublecortin domain containing 2; Enolase 1; Fibrinogen-like protein 1; Immune evasion; Intrahepatic Cholangiocarcinoma; Progression; Tumor-associated antigen.


Conflict of interest statement

Declarations. Ethics approval and consent to participate: The animal research was approved by the Institutional Animal Care and Use Committee of Shanghai Immunocan Biotechnology Co., Ltd (Approval Number: YMNK-AUA-01201, Approval Date: February 17th, 2023). The human research was approved by the Clinical Research Ethics Committee of Fudan University Zhongshan Hospital (Approval Number: B2023-299R2, Approval Date: December 11, 2023). Additionally, it should be noted that at our teaching hospital, all patients admitted for surgical procedures are required to sign consent forms allowing for the use of their surgical specimens for research purposes. Therefore, research involving surgical specimens is exempt from the requirement for explicit informed consent. Consent for publication: All authors have agreed with publishing this manuscript. Competing interests: The authors declare no competing interests.

Figures

Fig. 1
Fig. 1
DCDC2 is an ICC-associated antigen and is correlated with a poor prognosis. A Flow chart of the HuProt microarray analysis. B Volcano plot of TAAbs corresponding genes in the FUDAN cohort. C Fold change of mRNA level of the 7 differentially expressed genes in the TCGA-CHOL and Fudan-Cohort-I databases. D Expressions of the 7 genes in the FUDAN cohort. E The Expressions of DCDC2 in ICC and ECC in the Fudan-Cohort-I. F Plasma titer of DCDC2 autoantibody detected by ELISA in Fudan-Cohort-III. G The Representative IF image of DCDC2 in Fudan-Cohort-IV. H The representative IHC image of DCDC2 Fudan-Cohort-IV. Quantitative analysis was shown in the graphs. I The overall survival of Fudan-Cohort-IV with low or high DCDC2 expression is shown based on staining intensities in (I). ***p < 0.001
Fig. 2
Fig. 2
DCDC2 promotes ICC proliferation and metastasis. A CCK-8 assays showed that ectopic expression of DCDC2 promoted the proliferation ability of the ICC. B Colony formation assays showed that ectopic expression of DCDC2 promoted the colony formation of the ICC. C Tumor growth curves of nude mice inoculated with the vehicle, and DCDC2 overexpressed HuCC-T1 cells. D Tumor weight of nude mice inoculated with the vehicle, and DCDC2 overexpressed HuCC-T1 cells. E Transwell migration assays showed that overexpression of DCDC2 promoted the migration abilities of ICC cells. F Transwell invasion assays showed that overexpression of DCDC2 promoted the invasion abilities of ICC cells. G In vivo imaging (left) and quantitative analyses (right) of liver metastasis 5 weeks after injection. H Representative H&E staining image (left) and quantitative analyses (right) of liver metastasis node. ***p < 0.001
Fig. 3
Fig. 3
DCDC2 executed its oncogenic functions by AKT activation. A GSEA enrichment analysis was conducted on the differential genes in the group with high DCDC2 expression compared to the group with low DCDC2 expression. Simultaneously, GSEA enrichment analysis was performed on the differential genes in the Lenti-DCDC2 group compared to the Lenti-vector group in the HCCC-9810 RNA-seq database. B GSEA was conducted on the differential genes between the high and low DCDC2 expression groups in the TCGA-CHOL dataset and HCCC-9810 RNA-seq database, focusing on the enrichment scores for the PI3K-AKT signaling pathway. C The protein levels of p-AKTT308, p-AKTS473, and AKT in ICC cells overexpressing DCDC2 were assessed by Western blotting. D The CCK-8 assay was used to evaluate the proliferation of ICC cells treated with Perifosine (Peri, 10 μM). E Quantitative analyses of transwell migration assay in ICC cells treated with Peri (10 μM). F Quantitative analyses of transwell invasion assay in ICC cells treated with Perifosine (10 μM). ***p < 0.001
Fig. 4
Fig. 4
DCDC2 promotes ICC immune evasion and upregulates FGL1 expression. A Schematic diagram of humanized mouse xenograft model. B Overexpression of DCDC2 significantly promoted tumor weight of humanized mice. C Tumor growth curves of humanized mice showed overexpression of DCDC2 significantly promoted tumor growth. D Overexpression of Dcdc2 significantly promoted tumor weight of SB-1 derived syngeneic tumor. E Tumor growth curves of syngeneic model showed overexpression of Dcdc2 significantly promoted tumor growth. F Analysis of GSEA scores for immune-related pathways in the high DCDC2 expression group versus the low DCDC2 expression group using TCGA-CHOL and xenograft RNA-seq data. G Expression analysis of immune checkpoint ligands in tumor cells with high DCDC2 expression in the HCCC-9810 RNA-seq and xenograft RNA-seq databases. H Correlation analysis between DCDC2 and immune checkpoint ligands in the TCGA-CHOL database. I The expression of DCDC2 and FGL1 was positively correlated in human ICC tumors. J The relative expressions of FGL1 mRNA in ICC cells were assessed by qPCR after DCDC2 overexpression. K The protein levels of FGL1 in ICC cells were assessed by western blot after DCDC2 overexpression. L The protein levels of FGL1 in supernatant of ICC were assessed by ELISA after DCDC2 overexpression. M The relative expressions of GZMA, GZMB, TNF, IFNG of CD8+ T cells in scRNA-seq data. N The expressions of granzyme B and IFN-γ in CD8+ T cells in xenograft tumors of humanized mice were assessed by flow cytometry. O The expressions of granzyme B and IFN-γ in CD8+ T cells in allograft tumor of syngeneic model were assessed by flow cytometry. ***p < 0.001
Fig. 5
Fig. 5
DCDC2 interacts with ENO1. A Molecules (mostly proteins) after Co-IP were visualized by silver staining following electrophoresis. The white arrow demonstrated the specific band for MS. B The list of proteins detected after MS. C Co-IP and Western blot verified the interaction of DCDC2 and ENO1. D Representative Immunofluorescence image of DCDC2 and ENO1 in human ICC tissue. E HEK-293 T cells were co-transfected with the plasmids encoding Flag-DCDC2, Flag-DCDC2 1–115, Flag-DCDC2 120–225, Flag-DCDC2 230–476, and Myc-ENO1. Protein was immunoprecipitated using an Anti-Myc antibody. F HEK-293 T cells were co-transfected with the plasmids encoding Myc-ENO1, Myc-ENO1 1–138, Myc-ENO1 140–434 and Flag-DCDC2. Protein was immunoprecipitated using an Anti-Flag antibody
Fig. 6
Fig. 6
DCDC2 stabilized ENO1 by suppressing its ubiquitination. A The protein levels of DCDC2 and ENO1 were assessed by western blot after DCDC2 overexpression (left) or knockdown (right). B Overexpression of DCDC2 stabilizes ENO1. Cells were treated with 50 μM cycloheximide (CHX) for 0, 2, 4, 8, and 12 h, and the protein levels of ENO1 were assessed by western blot. C MG-132, but not CQ, partially rescued the decrease of ENO1 in DCDC2 knockdown cells. Cells were treated with 10 μM CQ or MG-132 for 8 h, and the protein levels of ENO1 were assessed by western blot. D The ubiquitination of ENO1 in cells overexpressing DCDC2 was detected by Co-IP and western blot. E Co-IP and western blot assessed the interaction of DCDC2, ENO1, FBXW7, and NEDD4L. ***p < 0.001
Fig. 7
Fig. 7
ENO1 promotes the transcription of FGL1. A The relative expressions of FGL1 mRNA in ICC cells were assessed by qPCR after ENO1 knockdown. B The protein levels of ENO1 were assessed by western blot after ENO1 knockdown. C The protein levels of FGL1 in supernatant of ICC were assessed by ELISA after ENO1 knockdown. D The two predicted binding sites and the corresponding mutants of ENO1 in FGL1 promoter region and relative luciferase activity in dual-luciferase reporter assay. E ENO1- or DCDC2-associated chromatin complexes were immunoprecipitated from HuCC-T1-Vector and HuCC-T1-DCDC2-OE cells. Precipitated DNA was analyzed for FGL1 promoter enrichment by qPCR (DCDC2-OE vs. Vector; IgG control). F The expressions of DCDC2 and ENO1 in cytoplasm and nucleus of ICC cells after DCDC2 overexpression were assessed by WB. G The relative expressions of FGL1 mRNA in DCDC2 overexpressed and ENO1 knocked-out cells were assessed by qPCR. H The protein levels of FGL1 in DCDC2 overexpressed and ENO1 knocked-out cells were assessed by western blot. I The protein levels of FGL1 in supernatant of DCDC2 overexpressed and ENO1 knocked-out cells were assessed by ELISA. ***p < 0.001
Fig. 8
Fig. 8
FGL-LAG-3 checkpoint is involved in DCDC2-induced immune evasion. A Correlation analysis was conducted on the immune signaling pathways enriched by GSEA in the high DCDC2 expression group with the immune signaling pathways enriched by the high expression groups of FGL1 or ENO1 in the TCGA-CHOL databases. B The TCGA-CHOL dataset was divided into high and low expression groups based on the median values of DCDC2/ENO1/FGL1 expression. Genes that were differentially expressed within the high DCDC2/ENO1/FGL1 expression group compared to the low DCDC2/ENO1/FGL1 group were subjected to GSEA for immune-related pathways. C Tumor growth curves of humanized mice inoculated with the vehicle or DCDC2 overexpressed HuCC-T1 cells treated with or without α-LAG-3. D Image (left) and tumor weight (right) of subcutaneous xenograft tumor of humanized mice inoculated with the vehicle or DCDC2 overexpressed HuCC-T1 cells treated with or without α-LAG-3. E The expressions of granzyme B and IFN-γ in CD8+ T cells in xenograft tumors of humanized mice were assessed by flow cytometry. F Tumor growth curves of subcutaneous tumors of syngeneic model. G&H Image (left) and tumor weight (right) of subcutaneous tumors of syngeneic model. I The expressions of granzyme B and IFN-γ in CD8+ T cells in subcutaneous tumors of syngeneic model were assessed by flow cytometry. ***p < 0.001
Fig. 9
Fig. 9
Diagram of the DCDC2 role in ICC

Similar articles

References

    1. Khan SA, Thomas HC, Davidson BR, Taylor-Robinson SD. Cholangiocarcinoma Lancet. 2005;366:1303–14. - PubMed
    1. Clements O, Eliahoo J, Kim JU, Taylor-Robinson SD, Khan SA. Risk factors for intrahepatic and extrahepatic cholangiocarcinoma: A systematic review and meta-analysis. J Hepatol. 2020;72:95–103. - PubMed
    1. Vithayathil M, Khan SA. Current epidemiology of cholangiocarcinoma in Western countries. J Hepatol. 2022;77:1690–8. - PubMed
    1. Roth GS, Neuzillet C, Sarabi M, Edeline J, Malka D, Lièvre A. Cholangiocarcinoma: what are the options in all comers and how has the advent of molecular profiling opened the way to personalised medicine ? Eur J Cancer. 2023;179:1–14. - PubMed
    1. Mosconi S, Beretta GD, Labianca R, Zampino MG, Gatta G, Heinemann V. Cholangiocarcinoma Crit Rev Oncol Hemat. 2009;69:259–70. - PubMed

MeSH terms